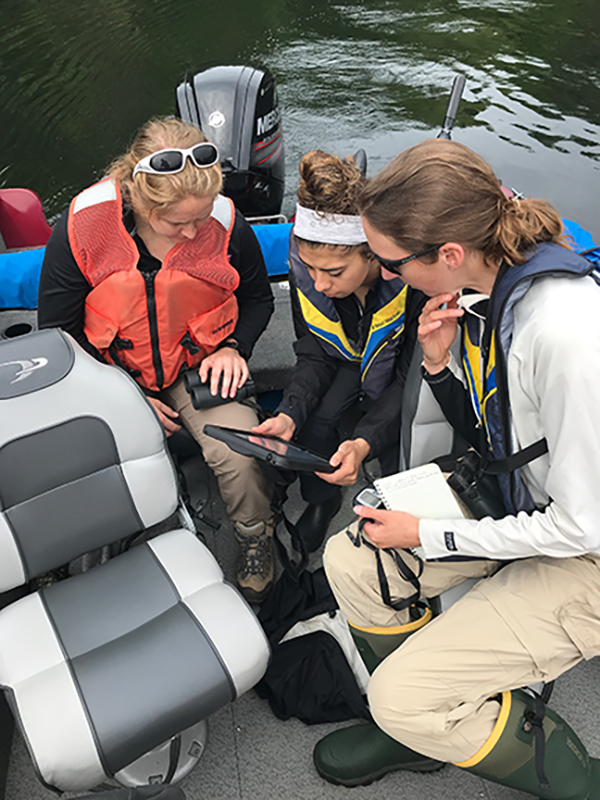
Field Data Collection
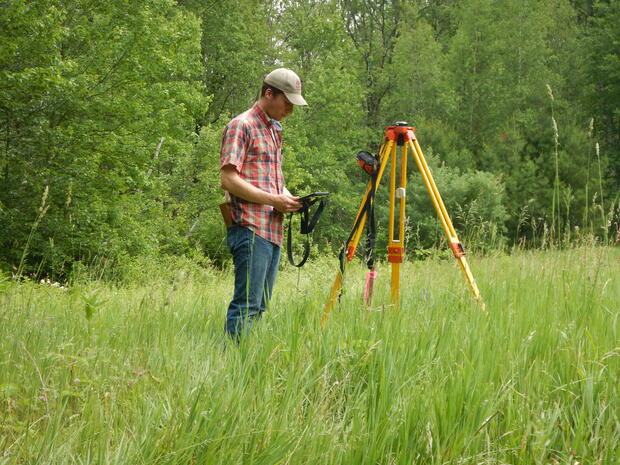
GIS-supported field data collection allows staff to collect detailed location and other types of information quickly and easily on iPads while in the field. Over the past five years, many paper-based workflows have been converted into more streamlined and efficient computer-based processes that utilize mobile apps designed for field work.
DWSP relies on tools from Environmental Systems Research Institute (Esri), a leading geospatial software company, to accomplish this work. These apps, including Field Maps, Survey123, and QuickCapture, are crucial to the success of many programs’ data collection efforts; many even work in areas of the watersheds where there is no cell coverage. Data collected in this way can then be used by staff within other ArcGIS Online tools or can be brought into desktop GIS to support mapping and analysis.
Dashboarding and Data Visualization for Decision-making
The ability to visualize data and interpret trends is crucial to ensuring data is used in decision-making processes. Traditionally, this is done by working with data in programs such as desktop GIS, Excel, or R. While those modes are still necessary, we also now use online Dashboards to convey complex location and attribute information on a single screen. Dashboards integrate maps, charts, lists, and graphics to create a visually appealing, interactive, and intuitive way to interpret data. DWSP is using Dashboards to present data trends and detailed information to assist in both internal decision-making and reporting, and as a method for communicating complex data trends to the public and stakeholders.
Here are some examples of public dashboards developed by DWSP:
Public/Stakeholder Engagement
The GIS Program facilitates public engagement through traditional printed maps, interactive online mapping applications and Dashboards. Several robust, user-friendly applications have been posted on the DCR website, including:
- Watershed Protection Act (WsPA) Viewer provides anyone the ability to see where the WsPA regulatory areas are on their property prior to any construction activity.
- DCR/DWSP Regional Gull Survey shares information with partners and stakeholders through a dashboard.
- Quabbin Park Cemetery facilitates an online experience for searching and exploring the cemetery.
StoryMaps are a great tool for communicating location information along with an engaging narrative by using maps with multi-media content like text, pictures and videos. Check out the DWSP StoryMap Gallery to see some examples.
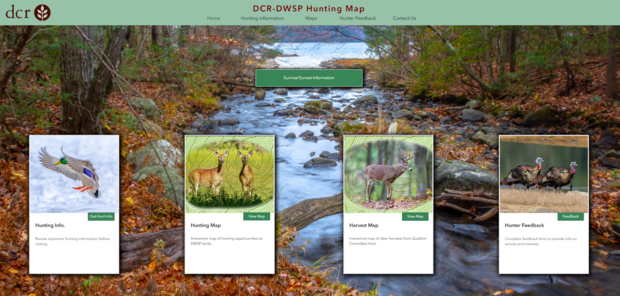
Interactive Public Access Map
The Division of Water Supply Protection has developed an interactive map with detailed information about public access roads and trails, fishing, and hunting in the Quabbin Reservoir, Ware River, Wachusett Reservoir, and Sudbury Reservoir watersheds. There are two ways to access this map: one is an online program that is accessible from your desktop computer or mobile device’s web browser; the other is through an App you can download directly to your mobile device and use in the field. The mobile device App is recommended for use in the field.
Click here to directly access the on-line DCR-DWSP Public Access Maps. Please see theInstructions for using DCR Division of Water Supply Protections Public Access Maps in ArcGIS Field Maps for information about the mobile app.
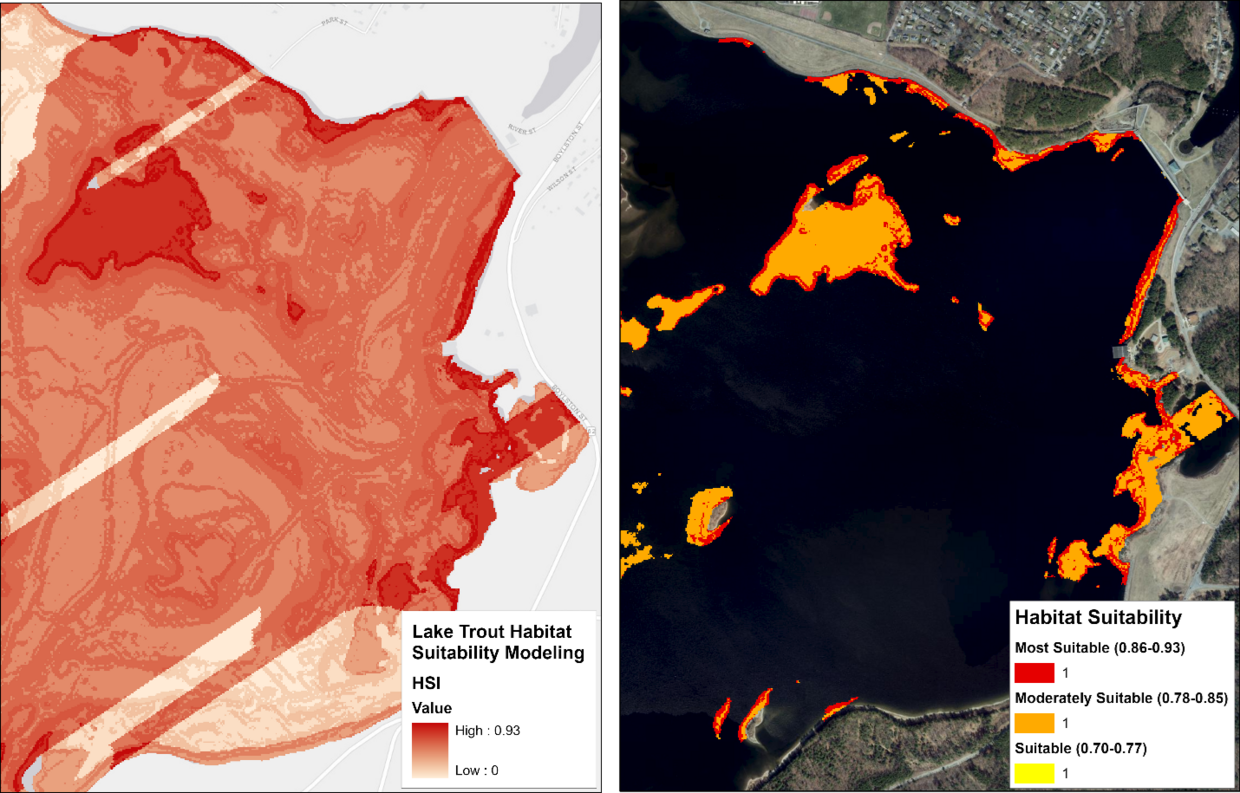
Spatial Analysis
Spatial analysis is key to answering place-based questions by comparing location and attribute information to look for trends or patterns in spatial data. The GIS program provides DWSP staff with expertise and assistance, as needed, in completing spatial analysis projects, including:
- Revise and expand the Land Acquisition Program’s Land Acquisition Model.
- Conduct an analysis of impervious surface and paved area percentages by watershed subbasin.
- Model Lake Trout habitat suitability in the Wachusett Reservoir.
Reporting
The Watershed GIS program lets staff combine data in standardized reports with the click of a button – a critical step for translating data collection efforts into a format that can be easily interpreted. Reports can include detailed information such as attribute data, map(s), image(s), or summary statistics. Reports are being successfully used by a variety of programs, including:
- Land Protection Program for monitoring of our Watershed Preservation Restrictions
- Watershed Protection Act (WsPA) Variance and Applicability Decisions
- Construction General Permit site inspection reporting and summary reporting for internal program support
- Nightly reporting for Bird Harassment Program activities
- Ranger quarterly reporting on violations

Workflow Automation
Automation allows DWSP staff to take advantage of some type of automatic action based on a “trigger.” A trigger could be a scheduled task on Windows, a Survey123 form submission, or a modification of an existing data record. DWSP is taking advantage of automation by making connections between our cloud-based GIS and Microsoft Power Automate. Some examples of automation at DWSP include:
- Sending email notifications to remind Planning staff about upcoming decision deadlines for filings in the Watershed Protection Act Database.
- Automatically creating new folders in designated SharePoint locations for the Environmental Quality Database.
- Updating the file status of Environmental Quality Database files when new entries are added to an Update Log.
Workflow automation can also power real-time dashboards such as the Quabbin Reservoir Boat Launch Area dashboard.
Cartography
This traditional function of the GIS program remains an important part of the way in which DWSP communicates geographic information with staff, stakeholders, and the public. Although the necessity of printed maps has declined with the increased use of online mapping applications, the Watershed GIS Program is able to use improved desktop GIS technology to provide high-quality, printable maps.