Introduction
The People with Disabilities Equity Dashboard offers a comprehensive view of employment-related insights, encompassing disability type, geographic variations, remote work opportunities, unemployment rates, labor force participation, and more.
This dashboard is part of the Department of Economic Research's workforce Equity Dashboard project, which aggregates Massachusetts-centric employment statistics across diverse demographic, racial, ethnic, and other identifiers. In addition to offering a snapshot of workforce outcomes among various demographic groups and illuminating persistent workforce disparities, these data sets underscore the substantial contributions and diverse talents and needs of Massachusetts' communities. The dashboards also serve as a benchmark to gauge the Commonwealth's progress in advancing equitable career pathways across all sectors of its economy.
The project was crafted with input from the MassAbility (formerly the Massachusetts Rehabilitation Commission), the Massachusetts Office on Disability, and others, who all provided valuable insights into the employment landscape for individuals with disabilities.
It should be noted that much of the data utilized in these narratives and dashboards is derived from the American Community Survey, conducted by the United States Census Bureau. Consequently, the naming conventions describing various demographic groups closely mirrors the terminology used in the survey and does not necessarily align with the naming preferences of the Department of Economic Research or the groups who collaborated on its creation.
Analysis and key takeaways
Demographics
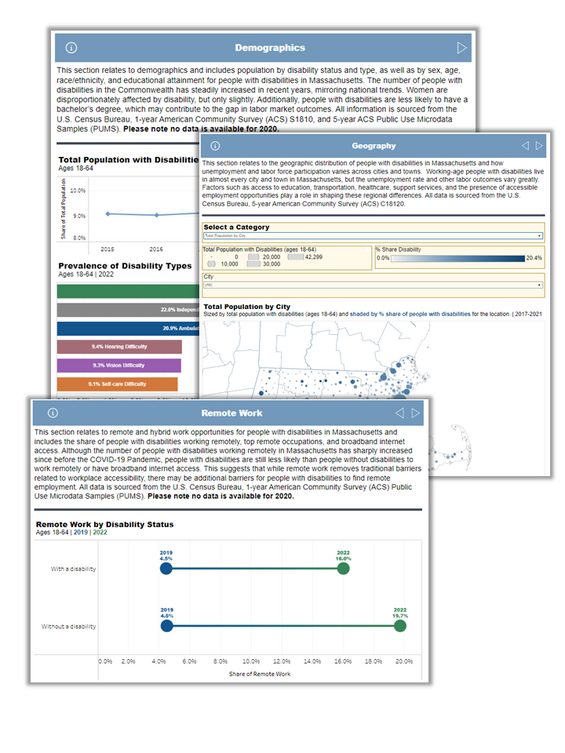
- Massachusetts is home to approximately 440,000 working-age individuals with disabilities, representing roughly 10% of the state's working-age population. This number has steadily increased in recent years, mirroring national trends. Notably, this rise is partly attributed to a significant increase in young people reporting cognitive difficulties.
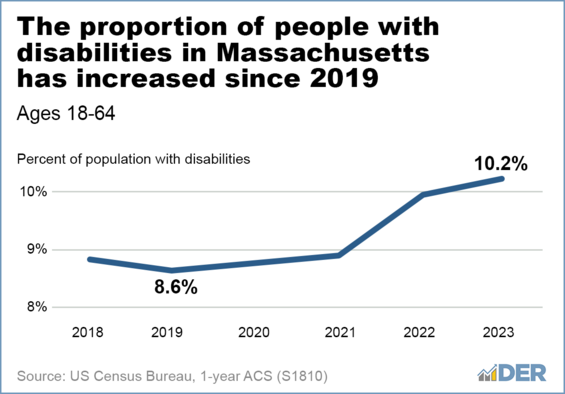
Please note no data is available for 2020.
- Among individuals with disabilities, the most prevalent types are cognitive difficulties, independent-living difficulties, and ambulatory difficulties. While women are disproportionately affected by disability, it's important to note that a substantial number of men are also living with disabilities.
- Despite the significant population size, working-age individuals with disabilities face challenges in attaining higher education. Compared to their non-disabled counterparts, they are significantly less likely to hold a bachelor's degree. This disparity points to both historic and current inequities in access to educational opportunities, which contribute to the persistent gap in labor market outcomes.
Employment
- Employment outcomes vary widely depending on the type of disability. For example, 58.2% of individuals who are deaf or hard of hearing are employed, compared to just 17.9% of those with an ambulatory disability. This is in stark contrast to the 82.2% employment rate among the population without a disability. These variations in employment rates can be attributed to a range of factors, including differences in skills and education, as well as the ability to work and find employment opportunities that accommodate specific disabilities. The limited availability of such opportunities presents significant barriers for people with disabilities seeking employment.

- The impact of these dynamics is evident in unemployment rates. Although unemployment rates across disability types have been declining since 2010, the COVID-19 pandemic has disproportionately affected people with disabilities. Unemployment rates for people with certain disabilities have increased significantly, even as rates for those without disabilities have returned to pre-pandemic levels. In 2023, 14% of people reporting an independent living difficulty in the labor market were unemployed and looking for work. Even among those who are Deaf or Hard of Hearing, who had similar unemployment rates to those without disabilities pre-pandemic, unemployment rates have doubled from 3.5% in 2019 to 7% in 2023.
- The share of people with a disability working part-time peaked in 2011 at 58.0% and then gradually decreased to 47.1% in 2023. In 2023, people with disabilities were about 50 percent more likely to work part-time compared to those without a disability. This could be attributed to various factors, including the flexibility part-time work offers, and the fact that individuals receiving Social Security Disability Insurance (SSDI) can work part-time and still receive their monthly payments. A full report on the disability benefit cliff effect in Massachusetts is available from DER.
- Note: Part-time employment encompasses individuals who worked fewer than 50 weeks during the year, which includes not only those typically working part-time hours but also individuals who experienced any breaks in employment over the course of the year.
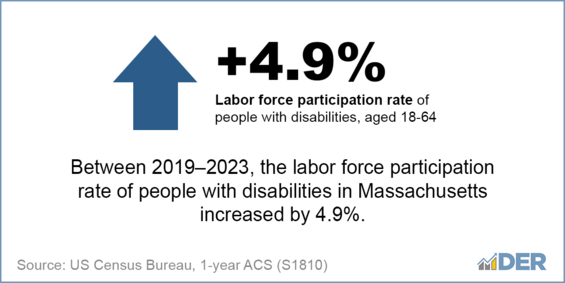
- Despite the challenges faced by people with disabilities in the labor market, there are some positive trends. The majority of disability types have seen labor force participation rates increase from 2019 to 2023, reflecting reduced barriers to employment brought about by remote work. This shift has expanded employment opportunities for people with disabilities, enabling them to participate more fully in the labor market.
Geography
- Nearly every city and town in the Commonwealth is home to working aged people with a disability. The five cities with the largest working-age populations of individuals with disabilities are Boston, Worcester, Springfield, Fall River, and Lowell, collectively accounting for nearly 100,000 working aged people with a disability, or a quarter of the total working-age population with disabilities.
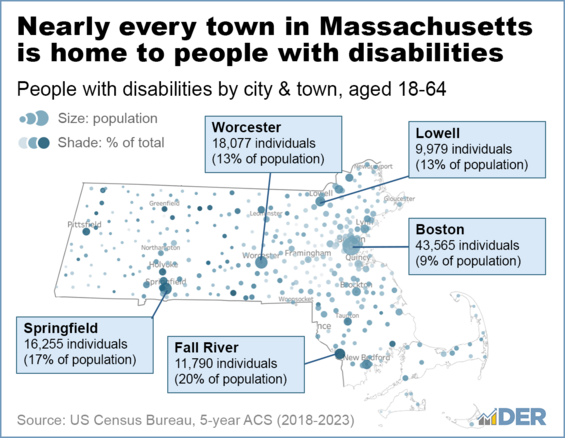
- Despite this widespread presence, there is significant variation in labor market outcomes across communities. For instance, the average unemployment rate for people with disabilities ranges from 12.1% in Lowell to 18.7% in Springfield. Regionally, individuals with disabilities experienced the highest average unemployment rates in Hampden County, Brockton County, and the Boston region, while the lowest unemployment rates were observed in the South Shore, Metro North, Metro South/West, and Cape & Islands. These differences suggest local factors play an important role in creating the conditions for employment among people with disabilities.
- These disparities in labor market outcomes point to structural inequities that have contributed to differences in employment opportunities for people with disabilities across the state. Factors such as access to education, transportation, healthcare, support services, and the presence of accessible employment opportunities play a role in shaping these regional differences.
Industry and occupation
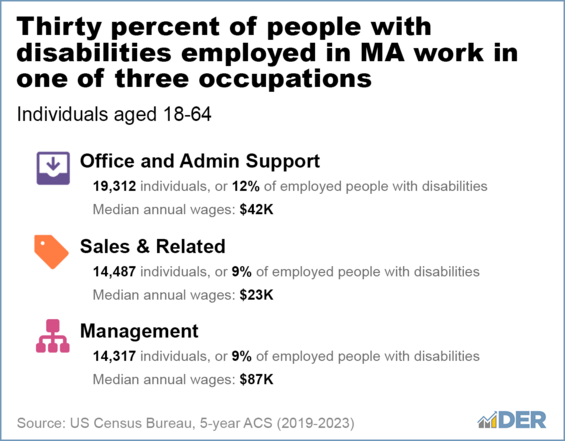
- People with disabilities in Massachusetts are employed in a wide range of occupations, but they are more likely to concentrate in certain sectors. The top three occupational sectors for people with disabilities in the state are office and administrative support, sales and related occupations, and management, accounting for over 30% of all employment among this population.
- However, people with disabilities are underrepresented in some high-paying occupations, such as business and financial and computer and mathematical occupations, suggesting potential barriers to entry and success in these fields. These barriers are reflected in the lower median annual earnings for people with disabilities compared to those without disabilities in most occupations. For example, the median annual earnings for people with disabilities in office and administrative support occupations are $41,600, compared to $46,800 for people without disabilities.
- Furthermore, people with disabilities are more likely to be employed in physically demanding occupations and industries characterized by high turnover rates. For instance, they are more likely to be employed in production occupations and food preparation and serving related occupations compared to those without disabilities.
- The top three industries for people with disabilities in Massachusetts are health care and social assistance, retail trade, and education services, which together account for over 40% of all employment among this population. However, people with disabilities are disproportionately employed in industries characterized by lower wages and higher turnover rates, such as the accommodation and food services industry.
Income and Poverty
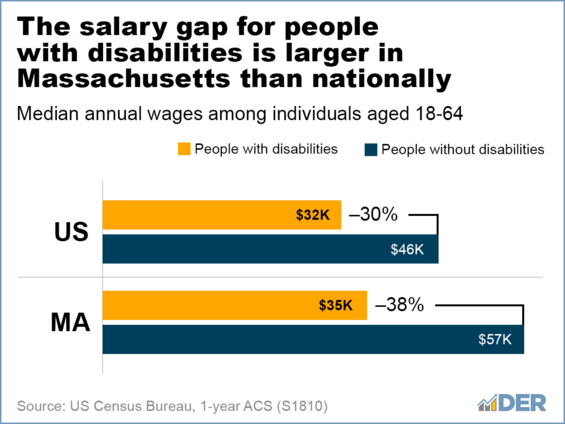
- The median earnings for people with disabilities in Massachusetts have shown a positive trend, increasing steadily from $20,782 in 2010 to $34,805 in 2023. However, it is important to note that the median earnings for this group are still significantly lower than those for people without disabilities. The gap between the median earnings for people with and without disabilities in Massachusetts is wider than the national gap, suggesting that people with disabilities in the state may face additional challenges in finding employment and earning a living wage in the Commonwealth.
- While many factors contribute to these trends, one key factor is that people with disabilities are more likely to work part-time. As data in the employment status tab shows, people with disabilities are 50% more likely to work part-time than those without disabilities. As a result, those who work part time will have lower earnings than those who work full-time.
- Additionally, working-aged people with disabilities are three times more likely to live in poverty than those without disabilities. This highlights the significant economic challenges faced by this population in Massachusetts.
Remote Work
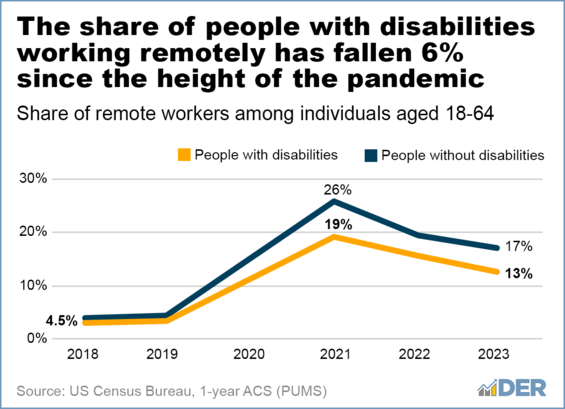
- A significant impact of the COVID-19 pandemic was the normalization of remote work. The shift towards remote work has been a boon for individuals with disabilities, removing traditional barriers to entry such as transportation and physical accessibility of workplaces. Between 2019 and 2023, the share of people with disabilities working from home increased by 280%.
- This shift has benefited workers in occupations conducive to working from home, while opening up new opportunities for others. Most people with disabilities work in business and financial, management, and office and admin support occupations.
- Yet, despite the added benefits working from home offers people with disabilities, they are less likely than those without disabilities to work from home. This can be attributed to several factors, such as the alignment between education and work experience with remote work occupations, as well as broadband access. In 2023, just 64% of working age people with a disability had broadband access, compared to 83% of those without a disability.
- From 2022-2023, there has been a 3% decrease in the prevalence of remote work across all workers, which may impact those with disabilities disproportionately.
People with disabilities equity dashboard
The below dashboard is structured into eight sections/tabs. Navigate through the sections by clicking the tabs along the top of the window, or by using the arrows in the top left corner. Each section includes a short summary at the top of the dashboard.
Hover your cursor over the information circle on the top left to reveal source information. Hover over different parts of the data visualizations to see additional and/or clarifying information.
Disability Types
As our data is largely dependent on the U.S. Census Bureau's American Community Survey (ACS), the disability types are based on the U.S. Census definitions of hearing, vision, cognitive, ambulatory, self-care, and independent living.
For additional detail, the ACS surveyasks respondents six questions to self-identify as having a disability.
The following questions serve as the basis for the Census disability type categories:
- Hearing: Is this person deaf or does he/she have serious difficulty hearing?
- Vision: Is this person blind or does he/she have serious difficulty seeing even when wearing glasses?
- Cognitive: Because of a physical, mental, or emotional condition, does this person have serious difficulty concentrating, remembering, or making decisions?
- Ambulatory: Does this person have serious difficulty walking or climbing stairs?
- Self-care: Does this person have difficulty dressing or bathing?
- Independent living: Because of a physical, mental, or emotional condition, does this person have difficulty doing errands alone such as visiting a doctor’s office or shopping?
Based on the survey questions regarding disability type, a respondent with disabilities may report one or more disabilities. As a result, the totals across disability types can exceed the total number of unique individuals with disabilities. For example, an individual that reports both a hearing and a cognitive difficulty is counted in two disability categories.
Given this methodology, the population totals for each disability type should also be interpreted as including individuals who have at least that specific disability. For instance, the unemployment rate calculation for those with a vision disability might include respondents who only have the specified disability or who also have other disabilities not explicitly mentioned.
Dashboard navigation
- Navigation: The dashboard is structured with a section (“tab”) for each of the 7 key areas of analysis as well as a concepts tab. You can navigate these sections by clicking the tabs along the top of the window or by using the arrows on the top right of the dashboard.
- Data insights: At the top of each section, there is a short summary of the data included on the tab and high-level data insights to help the reader understand important trends in the context of persons with disabilities to supplement data exploration.
- Concepts and data: In the “Concepts Tab”, users can view definitions and access links to the data used in the spreadsheet as well as the original data sources.
- Interactivity: By hovering the mouse cursor on sections of charts and graphs, a “tool tip” pop-up box is visible, providing additional clarification on the data being explored. Many tabs also include drop-down filters that allow users to adjust the type of data being displayed.
- Accessibility: DER implemented Web Content Accessibility Guidelines (WCAG) throughout the dashboard when possible to cater to a wide audience. This includes enlarging text when possible, and keeping a 4.5:1 or greater contrast ratio for small-size text and a 3:1 or greater contrast ratio for large text and components. Further, we’ve avoided using color alone to convey meaning by using techniques like patterns, markers, direct labeling, and tool tips.
Definitions and Methodology
Disability types
As our data is largely dependent on the U.S. Census Accessibility Community Survey, the disability types are based on the U.S. Census definitions of hearing, vision, cognitive, ambulatory, self-care, and independent living.
For additional detail, the ACS survey asks respondents six questions to self-identify as having a disability.
The following questions serve as the basis for the Census disability type categories:
- Hearing: Is this person deaf or does he/she have serious difficulty hearing?
- Vision: Is this person blind or does he/she have serious difficulty seeing even when wearing glasses?
- Cognitive: Because of a physical, mental, or emotional condition, does this person have serious difficulty concentrating, remembering, or making decisions?
- Ambulatory: Does this person have serious difficulty walking or climbing stairs?
- Self-Care: Does this person have difficulty dressing or bathing?
- Independent Living: Because of a physical, mental, or emotional condition, does this person have difficulty doing errands alone such as visiting a doctor’s office or shopping?
Based on the survey questions regarding disability type, a respondent with disabilities may indicate one or more disabilities, such as hearing and cognitive-related ones. As a result, the total counts for each disability can exceed the total number of people with disabilities since an individual may report multiple disabilities. It's important to remember this when examining charts with a disability type breakdown. For instance, the unemployment rate calculation for those with a vision disability might include respondents who solely have the specified disability, as well as those with additional disabilities not explicitly mentioned.
Population age groups
When conducting labor market analysis of people with disabilities, we follow the U.S. Census convention of limiting the analysis to working-age adults between 18-64 years old. There are two main reasons for this:
- People aged 65 and over make up a proportionately high percentage of people with disabilities. For example, a 2022 report by the Bureau of Labor Statistics (BLS) revealed that approximately 50% of the total population with disabilities were over the age of 65, compared to about 18% of those without disabilities.
- Those 65 and older have much lower labor force participation rates (LFPR) largely due to retirement. The BLS Report showed that that the LFPR for the general population aged 65-74 was 26.6% in 2022, compared to 8.1% for the population with disabilities.
In summary, people aged 65 and over make up a high percentage of those with disabilities but have a very low engagement with the labor force. Limiting the analysis to working-age adults between 18-64 years old allows for a more accurate representation of the employment circumstances for people with disabilities. This context is important to understand when interpreting labor market statistics and ratio for this population.
Race/ethnicity
Data on populations grouped by race are based on people who identify as a single race and includes people who identify as Hispanic or Latino, except for the white population which only include people who identify as white alone and not Hispanic or Latino.
Data on Hispanic and Latino populations include people who identify as any race.
Difference between Census American Community Survey 1-year estimates and 5-year estimates
Graphs/charts based on Census American Community Survey data may rely on either 1-year or 5-year estimates:
- 1-year estimates provide a point-in-time estimate for the population. Yet, because the same size is smaller, there are limitations in using 1-years estimates to calculate statistics for small geographies and sub-populations.
- 5-year estimates have larger samples that are collected over the 5-year period and are useful for detailed data and can be interpreted as a 5-year average. The advantage offered by the 5-year estimate is that it can be used to calculate statistics for small geographies and sub-populations like the number of workers with disabilities by occupation or industry.
Users should be cautious when comparing data from 5-year estimates to 1-year estimates and consider that 1-year estimates represent a point-in-time while 5-year estimates represent a 5-year average.
Data reference and download
Download the data sets used in the above resources by clicking the file under 'Additional Resources" below.
Data Sources
Data on populations and labor force participants comes from the U.S. Census American Community Survey (ACS). ACS summary tables and the ACS Public Use Microdata Sample (PUMS) are used to calculate statistics.
The following are the data sources used in the dashboard:
- ACS Tables
- B18120: Employment status by disability status and type
- B18121: Work experience by disability status and type
- B18130: Age by disability status by poverty status
- B18140: Median earnings in the past 12 months (in 2022 inflation-adjusted dollars) by disability status by sex for the population 16 years and over
- S1810: Work experience by disability status and type
- C18120: Work experience by disability status and type
- ACS PUMS
Note: Data source citations are listed at the bottom of each tab for reference. Census 2020 1-year ACS and PUMS is unavailable due to the pandemic.
Demographics
| Tab Name | ACS Source | Time Frame | Population Frame | Description |
|---|---|---|---|---|
| TotalPop | S1810* | 2015-2023 | 18-64 | Population with disability |
| Type | S1810* | 2015-2022 | 18-64 | Disability type counts |
| Age | S1810* | 2015-2023 | Total Population | Age distribution |
| Gender | S1810* | 2015-2023 | Total Population | Gender distribution |
| Race | S1810* | 2015-2023 | Total Population | Race/ethnicity distribution |
| Education | PUMS** | 2023 | 25-64 | Educational attainment |
*1-Year ACS **5-Year ACS |
Note: for the “Race” Tab, “% Share Disability” represents the percentage of the race or ethnicity group with disabilities in the given year.
Employment Status
| Tab Name | ACS Source* | Time Frame | Population Frame | Description |
|---|---|---|---|---|
| Unemployment | B18120 | 2010-2023 | 18-64 | Unemployment rates |
| EmpPop | B18120 | 2010-2023 | 18-64 | Employment-to-population rates |
| LFPR | B18120 | 2010-2023 | 18-64 | Labor force participation rates |
| PartTimeWorkShare | B18121 | 2010-2023 | 18-64 | Part-time work rates |
| *1-Year ACS |
Geography
Occupation/Industry
Wages and Poverty
Remote Work
Workforce Development Support
| Tab Name | Source* | Time Frame | Population Frame | Description |
|---|---|---|---|---|
| MassHire | US DOL, ETA | PY 2023 | WIOA Title I/III | MassHire participants (WIOA and Wagner-Peyser) |
| MRC | MassAbility (formerly MA Rehabilitation Commission) Annual Reports | FY 2018-2024 | MassAbility participants | Participants enrolled in training/education |
Additional Resources
-
Open XLSX file, 171.44 KB, People With Disabilities Workforce Data - Accessible.xlsx (English, XLSX 171.44 KB)