Featured
News & updates
2024 Massachusetts STEM summit
The 2024 Massachusetts STEM Summit will take place on May 15 at Bridgewater State University.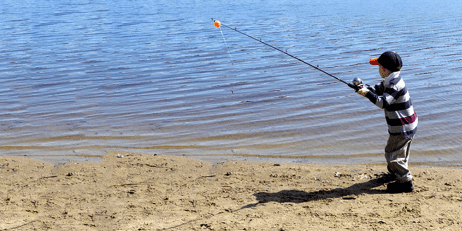
Spring trout stocking is underway
MassWildlife will stock about 455,000 trout this spring.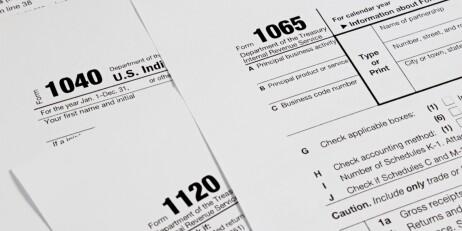
Tax season information
Important information from the Department of Revenue for filing your taxes.
Follow Us on Social Media: