Pedestrian safety
Pedestrian Safety
For the past five years (2017 – 2021), Massachusetts has averaged approximately 70 pedestrian fatalities per year. Males accounted for 60% of these deaths. In 2021, there were 76 pedestrian fatalities reported in Massachusetts.
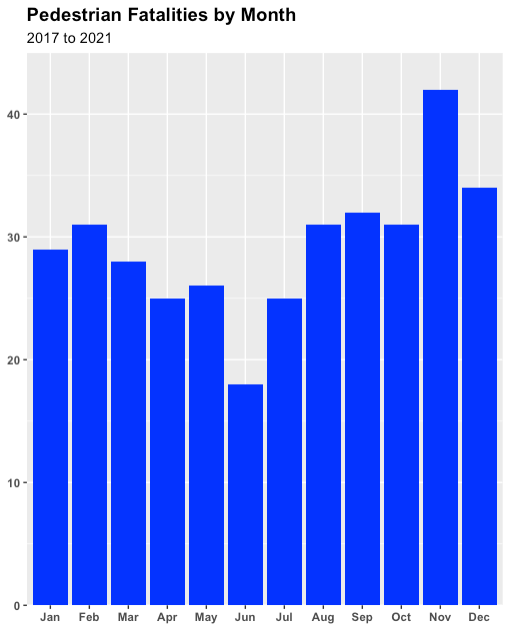
For the past five years, 55% of fatalities occurred between October and March. Pedestrian fatalities tended to occur more frequently during colder months than warmer ones. Factors include less daylight, affecting visibility, and lack of sidewalk access due to snow and ice.
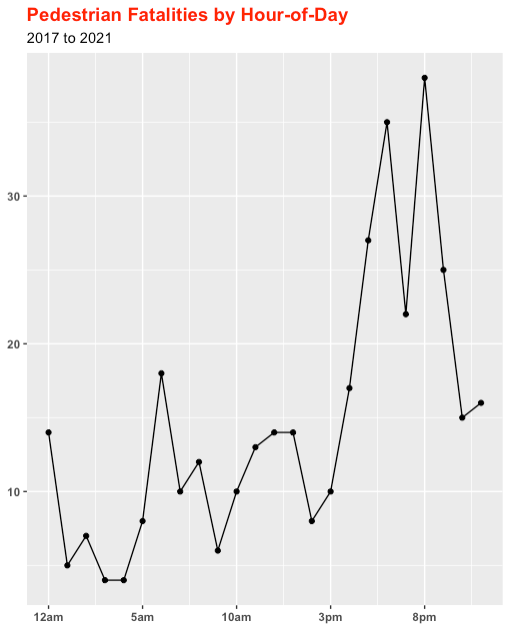
Over 40% of pedestrian fatalities occurred between 5 pm – 10 pm, with 8-9 pm accounting for 11% of the fatalities during that time frame. This time frame is typically associated with ‘rush hour’ and evening activities such as walking and running.
For the past five years, the average age of pedestrian fatalities has risen each year. Over three-fourths of deaths were age 35 or older, while fatalities among those under 25 years of age accounted for only 10%.
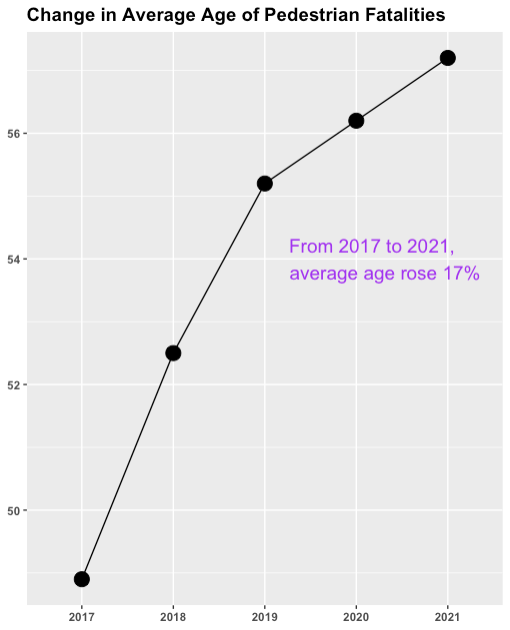
While this increase may seem troublesome, it is in line with the changing demographics of Massachusetts over the previous decade (2010-2019). Census totals show that the population of residents age 45 or older has increased by over 10% since 2010, while the younger population (age 24 or under) has declined by 3%. The most explosive growth came from the 65+ crowd, with an increase of 30% from 2010 to 2019.
To improve pedestrian safety, EOPSS/OGR/HSD supports local police departments by providing resources for enforcing laws the keep pedestrians safe; works with other state agencies and organizations seeking to create safe travel conditions; and launches public awareness campaigns through offline and online media.
Additional Resources
Bicycle safety
From 2017 to 2021, bicyclist fatalities accounted for 2% of fatalities reported in motor vehicle crashes across Massachusetts. The number of bicyclist fatalities has fluctuated from a high of 11 to a low of four, averaging approximately seven deaths per year. During these five years, males represented nearly 90% of bicyclist deaths. In 2021, there were five bicyclist fatalities – down from 10 reported in 2020.
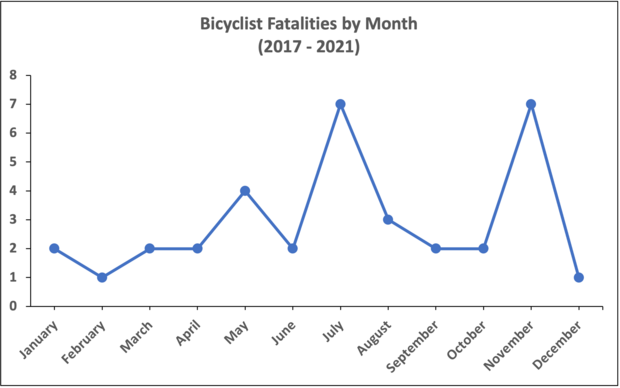
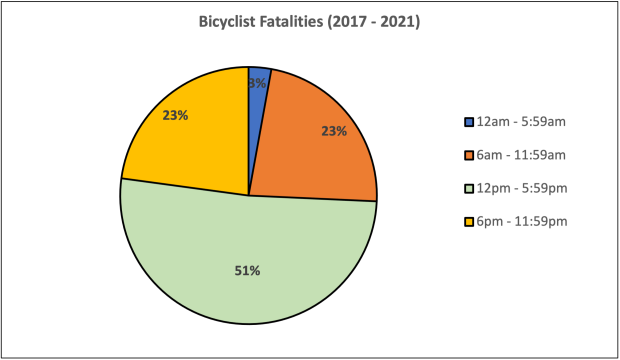
Over the past five years, bicyclist fatalities have occurred most often in July and November. Half of all bicyclist fatalities took place between 12 pm and 6 pm.
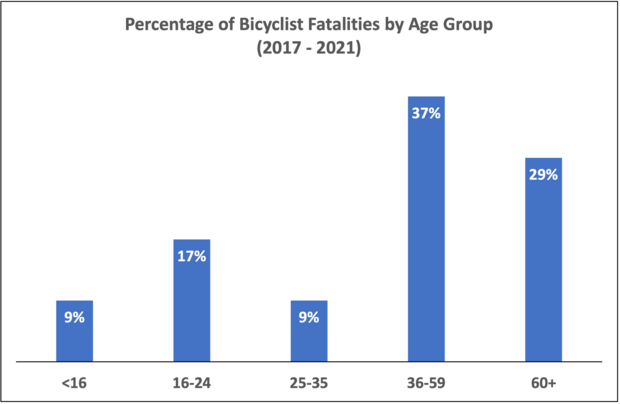
Much like pedestrian fatalities, most bicyclist fatalities were over 35 years old. Those under age 16 accounted for 9% of deaths. Nearly 30% of bicyclist fatalities occurred at an intersection from 2017 to 2021, highlighting the importance of environment awareness for both drivers and bicyclists.
EOPSS/OGR/HSD supports local police departments by providing resources to help enforce laws to improve bicycle safety. The agency also develops public awareness campaigns through traditional and new media. We work with other state agencies and community organizations to create safe road conditions for all users.