Notifications - Summary
- How many releases have been reported to DEP?
Since 1984, more than 58,000 releases have been reported to the Department.
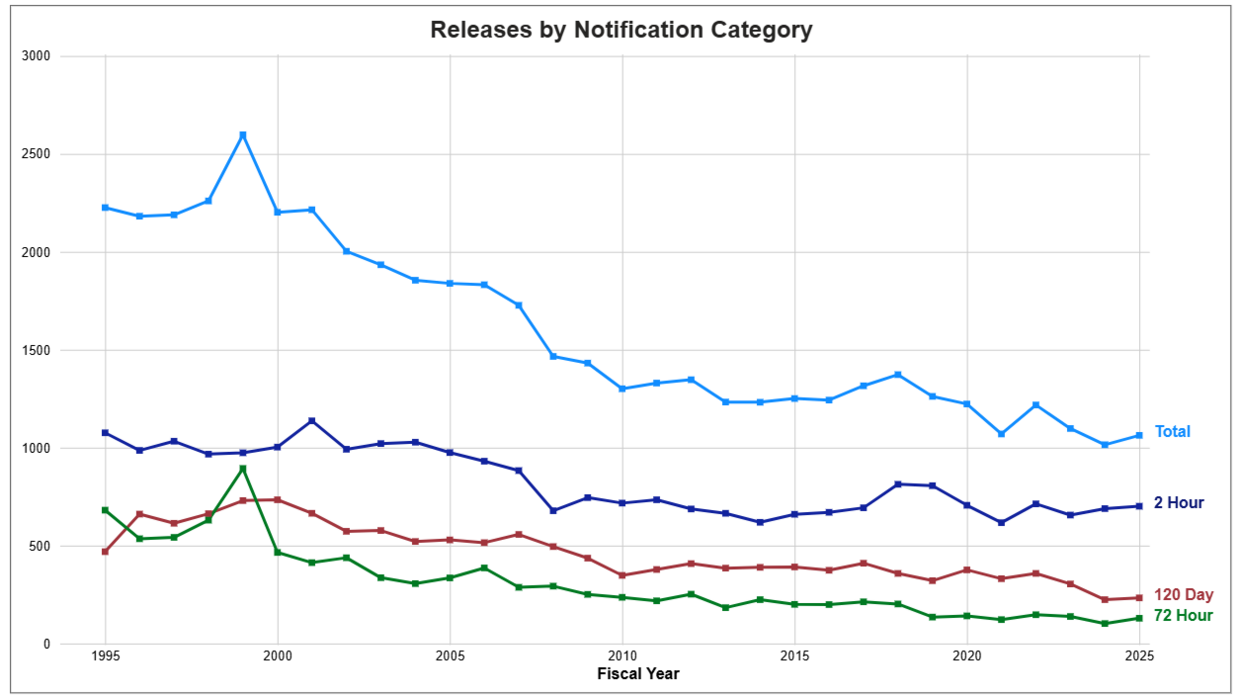
- What accounts for the most notifications: sudden releases (spills) or historic contamination?
Two-hour notifications, primarily related to new spills, account for 57 percent of all the notifications received since 2011. The balance of notifications is split between: 120-Day notifications, generally associated with finding historic contamination at concentrations above Reportable Concentrations; and 72-Hour notifications, which include (among other conditions) leaking tanks, groundwater contamination near a public well or near/at a private well, and actual/potential impacts to indoor air.
- Are the numbers of spills increasing each year?
No. There has been an overall decline of all three types of notifications (2-Hour, 72-Hour and 120-Day) over time. This trend is consistent with better environmental management practices, upgrades in underground storage tanks, and a diminishing universe of undiscovered "historic" contamination. The notable increase in 72-Hour notifications in 1999 is attributable to the discovery of contamination related to leaking underground storage tanks driven by the federal deadline for the upgrade or replacement of underground storage tanks.
Cleanup & Closures - Summary
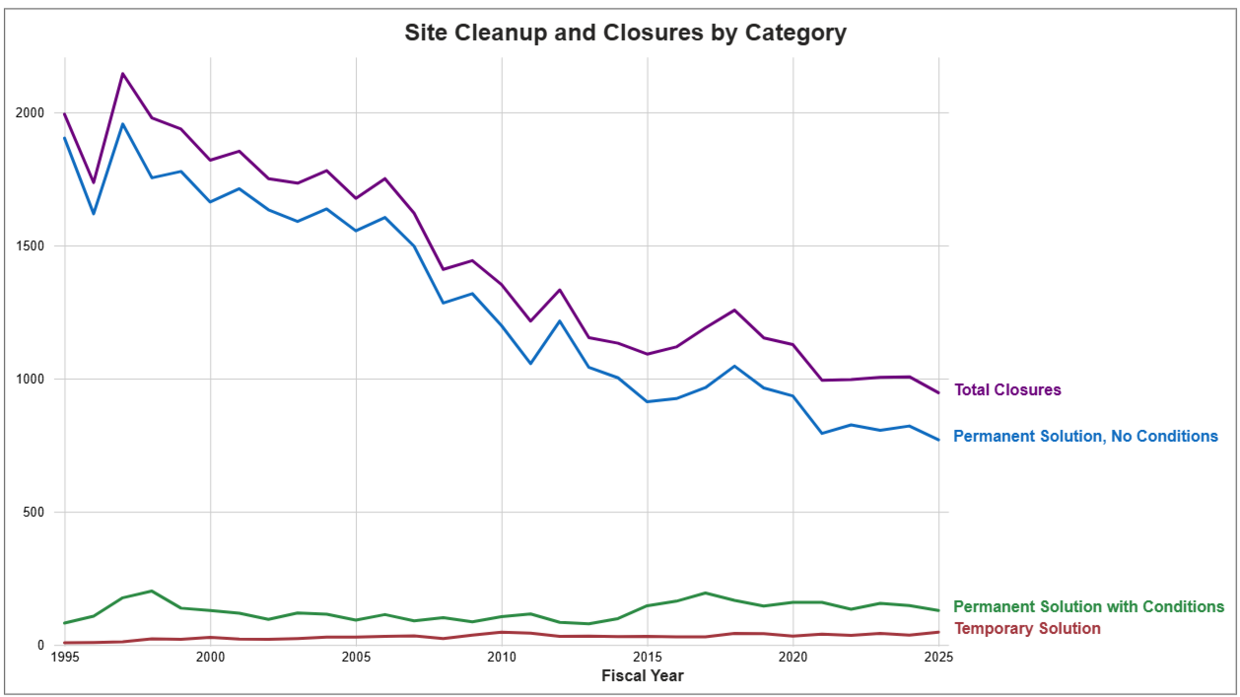
- How many sites have been cleaned up since 1993?
45,332 sites, averaging over 1400 per year.
- How many sites have been cleaned for unrestricted use?
A Permanent Solution with No Conditions has been achieved at 40,401 sites (or almost 90%), indicating that the site is suitable for unrestricted use. (This includes sites that have achieved Class A-1, A-2, and B-1 Response Action Outcomes – the closure categories that were in place prior to the 2014 regulatory changes.)
- How many sites have achieved temporary solutions?
A Temporary Solution has been achieved at 956 (2%) of the sites cleaned up to date. (Temporary Solutions were referred to Class C RAOs prior to Spring 2014.)
- At how many of the sites with a Permanent Solution was a deed notice or restriction (i.e., an Activity and Use Limitation) used as part of the remedy?
Between 1994 and 2025, 7% of Permanent Solutions included an Activity and Use Limitation (AUL) as part of the final remedy.
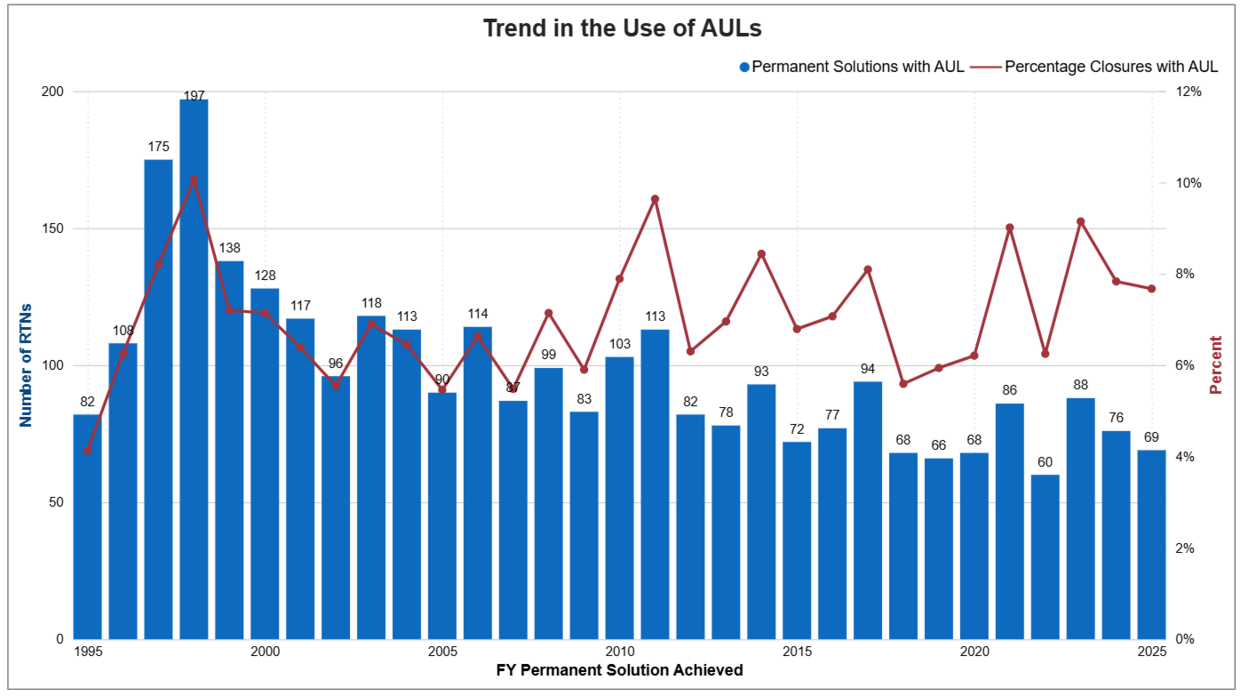
Note: FY2021: the number of sites closed with AULs did not increase significantly over past years, so the observed percentage increase may be due more to the drop in 2-hour notifications during the pandemic. 2-Hour notifications tend to be closed without AULs. Time will tell if this is a trend.
- How long does the cleanup process take?
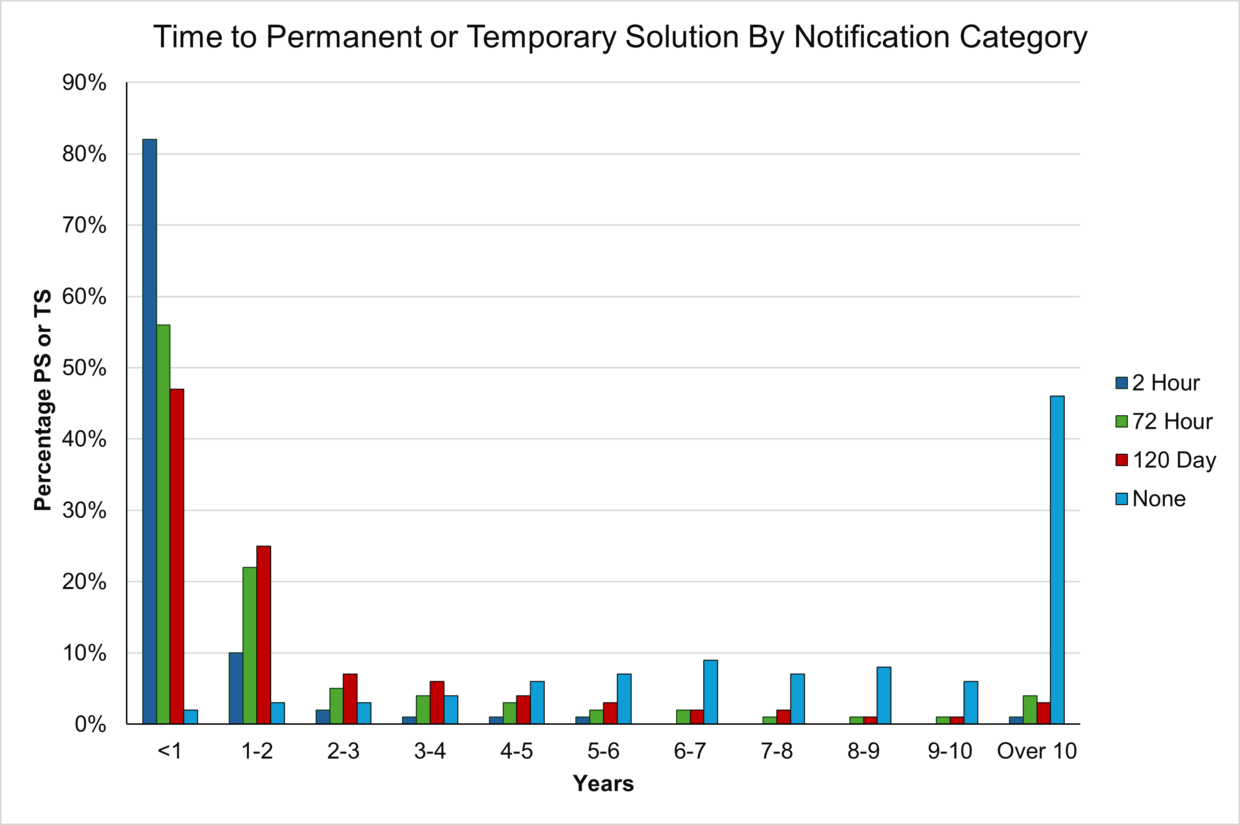
Over 90% of the releases from FY95 to FY19 have achieved regulatory closures in less than six years from the time of notification. Over the past 15 years, this measure appears to have stabilized at approximately 93% (+/-). For the purpose of the chart below sites with regulatory closure include those with the compliance status of: Permanent Solution with No Conditions, Permanent Solution with Conditions, Adequately Regulated, Downgradient Property Status, RTN Closed, Memorandum of Understanding (DEPMOU), Not a Disposal Site (DEPNDS), DEP No Further Action (DEPNFA), LSP No Further Action (LSPNFA), Pending Not a Disposal Site (PENNDS), Pending No Further Action (PENNFA), Special Project (SPECPR), Utility-related Abatement Measure (URAM), Waiver Completion Statement (WCSPRM).
The chart below shows the length of time to achieve a Permanent or Temporary Solution from the time of notification by notification type (2-Hour, 72-Hour or 120-Day). The time required to achieve a Permanent or Temporary Solution is less than 6 years in the vast majority of cases and for all notification types (2 Hour - 97%, 72 Hour - 91%, 120 Day - 92%). Note that pre-FY1994 sites (Notification Category = "None") required significantly more time to achieve closure.
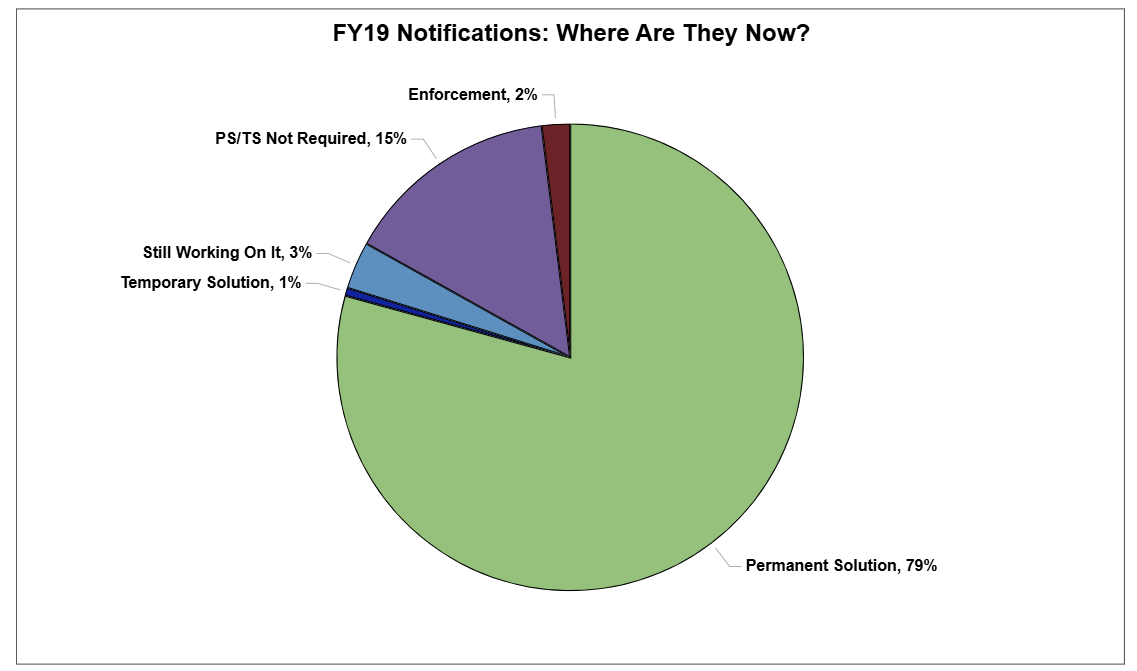
The chart below shows the current status of notifications made in FY2019. The chart shows that for the majority of sites for which the notification was made either a Permanent Solution has been achieved or a Permanent/Temporary Solution is not required within 6 years. (The most common reasons why a Permanent or Temporary Solution is not required is because the notification condition has been “linked” (i.e., response actions consolidated) under another notification and release tracking number. Other reason include the site is considered Adequately Regulated, Downgradient Property Status has been achieved or a Utility-related Abatement Measure is being conducted.)
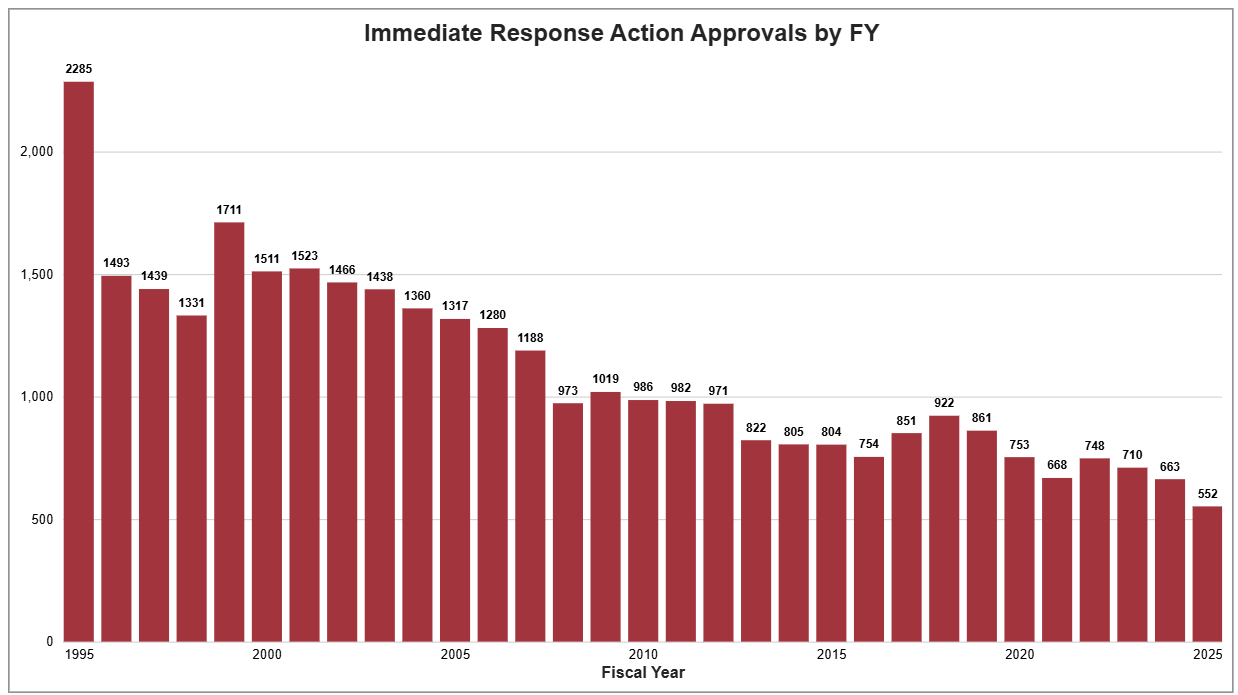
Immediate Response Actions
Immediate Response Actions (IRAs) are required to address any condition that triggers a 2-Hour or 72-Hour notification to the Department. IRAs are expedited response actions that include at a minimum assessment, and where appropriate, actions to contain, isolate, or remove contamination from the environment that is the result of a release or address a threat of release. IRAs require approval by the Department. The chart below shows IRA approvals (both oral and written) by the Department by Fiscal Year (FY).
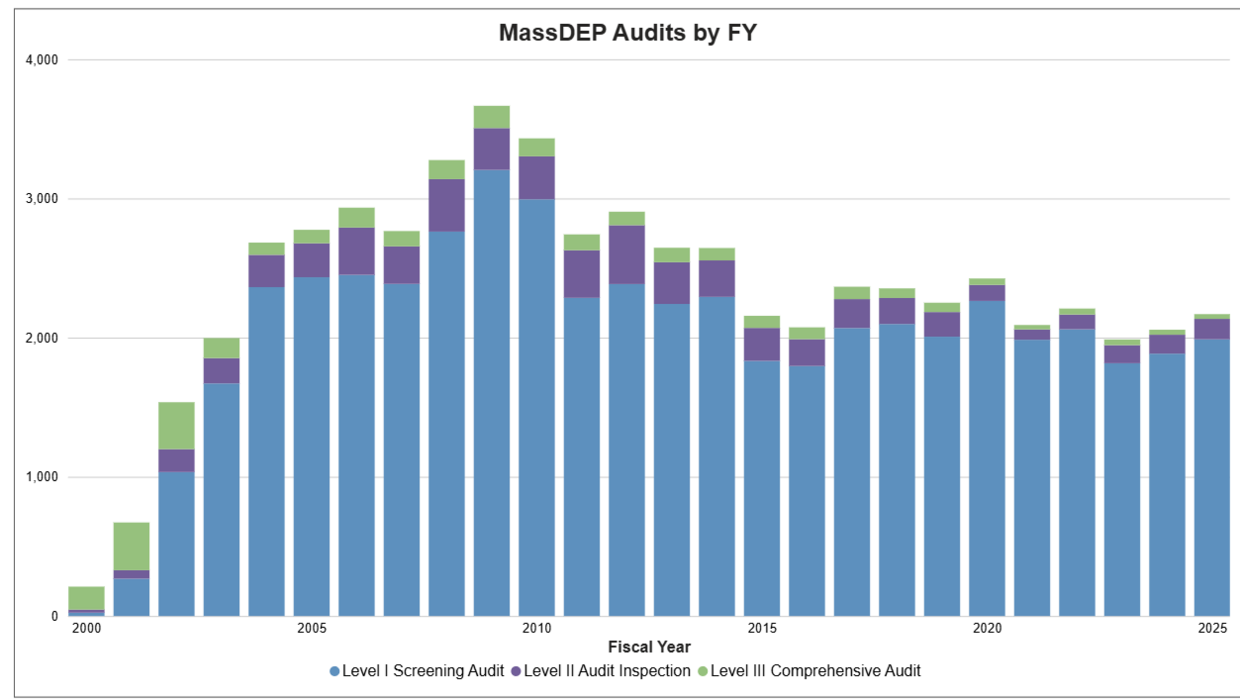
Audits
Since FY2000 MassDEP has conducted over 61,000 audits of response action submittals to evaluate and ensure compliance of those submittals and the associated response actions with the Massachusetts Contingency Plan. MassDEP conducts three different types of audits, which are referred to as Level 1 (Technical Screening Audit), Level 2 (Audit Inspection), and Level 3 (Comprehensive Audit). (Link to Audits Page) The majority of all audits conducted by MassDEP over time (86%) have been Level 1 Audits. The chart below shows the number of audits completed by fiscal year and the type of audit.
Notifications - Year-by-Year Data
| Fiscal Year | 2-Hour | 72-Hour | 120-Day | "None" | Total |
|---|---|---|---|---|---|
| 1985 | 0 | 0 | 0 | 21 | 21 |
| 1986 | 0 | 0 | 0 | 194 | 194 |
| 1987 | 0 | 0 | 0 | 1221 | 1221 |
| 1988 | 0 | 0 | 0 | 399 | 399 |
| 1989 | 0 | 0 | 0 | 1295 | 1295 |
| 1990 | 0 | 0 | 0 | 1162 | 1162 |
| 1991 | 0 | 0 | 0 | 623 | 623 |
| 1992 | 0 | 0 | 0 | 505 | 505 |
| 1993 | 0 | 0 | 0 | 551 | 551 |
| 1994 | 1052 | 711 | 226 | 945 | 2934 |
| 1995 | 1076 | 681 | 469 | 0 | 2226 |
| 1996 | 986 | 535 | 661 | 0 | 2182 |
| 1997 | 1033 | 542 | 614 | 0 | 2189 |
| 1998 | 967 | 630 | 663 | 0 | 2260 |
| 1999 | 974 | 894 | 730 | 0 | 2598 |
| 2000 | 1003 | 465 | 734 | 0 | 2202 |
| 2001 | 1137 | 413 | 665 | 0 | 2215 |
| 2002 | 992 | 438 | 573 | 0 | 2003 |
| 2003 | 1021 | 336 | 577 | 0 | 1934 |
| 2004 | 1028 | 306 | 521 | 0 | 1855 |
| 2005 | 975 | 335 | 529 | 0 | 1839 |
| 2006 | 931 | 386 | 515 | 0 | 1832 |
| 2007 | 883 | 287 | 557 | 0 | 1727 |
| 2008 | 678 | 293 | 495 | 0 | 1466 |
| 2009 | 745 | 251 | 436 | 0 | 1432 |
| 2010 | 717 | 236 | 348 | 0 | 1301 |
| 2011 | 734 | 218 | 378 | 0 | 1330 |
| 2012 | 687 | 252 | 407 | 0 | 1347 |
| 2013 | 665 | 183 | 385 | 0 | 1233 |
| 2014 | 619 | 224 | 389 | 0 | 1232 |
| 2015 | 660 | 200 | 391 | 0 | 1251 |
| 2016 | 670 | 199 | 374 | 0 | 1243 |
| 2017 | 693 | 213 | 410 | 0 | 1316 |
| 2018 | 813 | 202 | 358 | 0 | 1373 |
| 2019 | 806 | 135 | 321 | 0 | 1262 |
| 2020 | 706 | 141 | 376 | 0 | 1223 |
| 2021 | 617 | 122 | 331 | 0 | 1070 |
| 2022 | 713 | 147 | 358 | 0 | 1218 |
| 2023 | 656 | 138 | 304 | 0 | 1098 |
| 2024 | 689 | 102 | 224 | 0 | 1015 |
| 2025 | 701 | 129 | 233 | 0 | 1063 |
| Total-to-Date: | 26647 | 10365 | 14608 | 6820 | 58440 |
Cleanup & Closures - Year-by-Year Data
| Fiscal Yeara | PSNCb | PSCb | TMPSb | Grand Total |
|---|---|---|---|---|
| 1994 | 609 | 12 | 1 | 622 |
| 1995 | 1903 | 82 | 8 | 1993 |
| 1996 | 1619 | 108 | 9 | 1736 |
| 1997 | 1956 | 177 | 12 | 2145 |
| 1998 | 1754 | 202 | 23 | 1979 |
| 1999 | 1778 | 138 | 21 | 1937 |
| 2000 | 1633 | 129 | 28 | 1820 |
| 2001 | 1713 | 119 | 22 | 1854 |
| 2002 | 1634 | 96 | 21 | 1751 |
| 2003 | 1590 | 120 | 24 | 1734 |
| 2004 | 1637 | 115 | 29 | 1781 |
| 2005 | 1555 | 93 | 29 | 1677 |
| 2006 | 1605 | 114 | 32 | 1751 |
| 2007 | 1497 | 90 | 34 | 1621 |
| 2008 | 1284 | 102 | 24 | 1410 |
| 2009 | 1319 | 87 | 37 | 1443 |
| 2010 | 1199 | 106 | 48 | 1353 |
| 2011 | 1056 | 116 | 44 | 1216 |
| 2012 | 1216 | 85 | 32 | 1333 |
| 2013 | 1042 | 79 | 33 | 1154 |
| 2014 | 1003 | 99 | 31 | 1133 |
| 2015 | 913 | 147 | 32 | 1092 |
| 2016 | 925 | 164 | 30 | 1119 |
| 2017 | 966 | 195 | 30 | 1191 |
| 2018 | 1047 | 167 | 43 | 1257 |
| 2019 | 965 | 146 | 42 | 1153 |
| 2020 | 935 | 160 | 33 | 1128 |
| 2021 | 794 | 160 | 40 | 994 |
| 2022 | 826 | 134 | 36 | 996 |
| 2023 | 806 | 156 | 43 | 1005 |
| 2024 | 822 | 148 | 37 | 1007 |
| 2025 | 770 | 129 | 48 | 947 |
| Grand Total | 40401 | 3975 | 956 | 45332 |
For a complete explanation of the terms and acronyms used here, see the document, "Understanding the Waste Site/Release Look Up Search Results" below.
a Prior to June 20, 2014, the Massachusetts Contingency Plan (MCP) used different Response Action Outcome (RAO) classes to identify Permanent and Temporary Solutions. After the June 2014 MCP amendments, RAO classes were recategorized into types of Permanent or Temporary Solutions in accordance with the transition provisions at 310 CMR 40.1055 (see below).
310 CMR 40.1055 Transition Provisions
- (1) As of June 20, 2014, all Class A-1, A-2 and B-1 Response Action Outcomes submitted to the Department prior to June 20, 2014 shall be Permanent Solutions with No Conditions.
- (2) As of June 20, 2014, all Class A-3, A-4, B-2 and B-3 Response Action Outcomes submitted to the Department prior to June 20, 2014 shall be Permanent Solutions with Conditions.
- (3) As of June 20, 2014, all Class C-1 Response Action Outcomes submitted to the Department prior to June 20, 2014 shall be Temporary Solutions as described in 310 CMR 40.1050(1)(e)1.
- (4) As of June 20, 2014, all Class C-2 Response Action Outcomes submitted to the Department prior to June 20, 2014 shall be Temporary Solution as described in 310 CMR 40.1050(1)(e)2.
b
- PSNC - Permanent Solution with No Conditions
- PSC - Permanent Solution with Conditions
- TMPS - Temporary Solution
Additional Resources
-
Open PDF file, 463.91 KB, Understanding the Waste Site/Release Look Up Search Results (English, PDF 463.91 KB)
EEA Data Portal
The Data Portal provides access to search and interact with regulatory data, including MassDEP data pertaining to Permits, Facilities, Inspections, and Enforcements.