PFAS in Freshwater and Fish Tissue (2022)
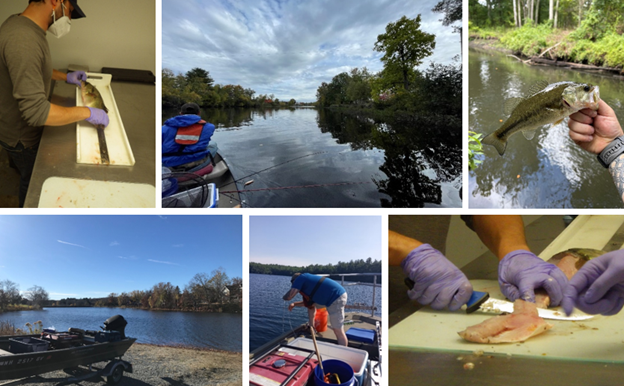
In the summer and fall of 2022, surface water and fish tissue samples were collected from 52 waterbodies throughout the state. While these efforts focused on waterbodies near known or suspected sources of PFAS and were therefore expected to have high PFAS concentrations, samples were also collected at six waterbodies in rural areas for comparison (i.e., “reference” waterbodies). Co-located surface water and fish samples were collected at each waterbody, and additional surface water samples were collected at a subset of waterbodies near beach swimming areas. A maximum of 45 fish were collected at each waterbody, per the Scientific Collection Permit issued by the Massachusetts Division of Fisheries and Wildlife. At lakes and ponds, up to three fish species were sampled, while at rivers and streams, up to two fish species were sampled. Skin-off fillets were prepared from each fish and combined into composite samples containing tissue from up to five similarly sized fish from the same waterbody and of the same species. In total, 66 surface water and 242 fish tissue composite samples (comprised of 948 fish) were analyzed for 40 PFAS compounds using the draft EPA Method 1633. The sampling results were evaluated against the project’s data quality objectives (DQOs) contained in the project QAPP and were validated by MassDEP.
Using the validated final data, descriptive statistics were calculated for surface water and fish tissue samples across waterbodies by PFAS analyte. Weighted statistics were used for fish tissue, with weights equal to the number of individual fish within a composite sample. Differences in PFAS concentrations were also explored for several variables, including type of waterbody (source-impacted or reference), proximity to environmental justice (EJ) census blocks, MassDEP-designated regions, and waterbody type (lakes and ponds versus rivers). Results are provided for individual PFAS analytes, as well as for the sum of detected concentrations for all 40 PFAS measured by the laboratory (∑PFAS40) and the sum of detected results for the six PFAS analytes regulated in public drinking water sources in Massachusetts (i.e., PFOS, PFOA, PFHxS, PFNA, PFHpA, and PFDA – referred to as PFAS6). Correlation was investigated between PFAS analytes within each media and across media, as well as between water samples collected at beach and open water locations within the same waterbody. Bioaccumulation factors (BAFs) were calculated for PFAS analytes detected in fish tissue, with a focus on the most frequently caught species across waterbodies (i.e., bluegill, pumpkinseed, yellow perch, and largemouth bass).
Summary of Results
- With respect to health-based screening values using MDPH draft guidance (2023), open water PFAS concentrations from at least one waterbody (Ashumet Pond) were high enough to potentially trigger confirmatory sampling and/or site-specific evaluation by DPH pursuant to recreational use of the permitted bathing beach. Also, several waterbodies had PFAS concentrations at bathing beach locations high enough to warrant confirmatory sampling by MDPH. For fish, all but one waterbody had at least one sample with a concentration above MDPH’s draft action limit of 0.22 ng/g for at least one of the seven PFAS for which MDPH issues fish consumption advisories.
- All surface water concentrations of PFOS and PFOA were well below EPA’s draft acute and chronic water column Aquatic Life Ambient Water Quality Criteria values. All fish tissue concentrations of PFOS and PFOA were also well below EPA’s draft Aquatic Life Ambient Water Quality Criteria values (for fish muscle).
- The PFAS analytes driving the ∑PFAS40 differed across media, with PFOA having the highest relative concentrations in surface water and PFOS having the highest relative concentrations in fish tissue. PFOA was detected in surface water from all waterbodies. PFOS was detected in 99% of composite fish tissue samples and in at least one sample from each waterbody.
- There were significant differences in PFAS concentrations measured in surface water and fish tissue between source impacted and reference waterbodies and by region, but not between rivers/streams and lakes/ponds. While there were no significant differences observed in PFAS concentrations between waterbodies located within one mile of an EJ census tract and those located more than one mile away from an EJ census tract, median and mean PFAS concentrations were consistently higher in waterbodies near EJ census tracts.
- In analysis of the four most frequently caught species, there were significant differences in Σ40PFAS between species within the same waterbody, with pumpkinseed having the lowest concentrations and largemouth bass having the highest concentrations of Σ40PFAS.
- Species-specific geometric mean bioaccumulation factors calculated for PFNA and PFOS using data from this study are consistent with those reported from other studies in the peer-reviewed literature. The BAFs indicate the degree to which each analyte may accumulate over time in fish from surface water.
The findings and descriptive statistics presented in the project report pertain to PFAS contamination levels in the waterbodies sampled. One should not infer that these statistics represent average conditions in Massachusetts, since the study design did not involve randomized site selection of a statistical sampling population.
It is also important to note that while the analytical method used (draft EPA 1633) tested for 40 PFAS analytes (including many of the more commonly used and observed PFAS), there are thousands of additional PFAS compounds in existence – many of which may be present in environmental media but are not included in current analytical methods. As a result, the ∑PFAS40 data likely underestimate the true total PFAS concentrations present in surface water and fish tissue. This study used the uppercase sigma notation (∑) to denote the inherent limitations on any estimates of “total” PFAS.
PFAS concentrations in surface water and fish tissue in many states and countries continue to be a major concern for human health and the environment. Although limited to freshwaters, findings from this study add to the growing body of evidence that PFAS are ubiquitous in the environment. The results of this study characterized the environmental burden and human exposure to PFAS in Massachusetts at targeted waterbodies selected based on the presence or absence of known or suspected contamination, with priority given to waterbodies with high fishing pressure and proximity to environmental justice communities. PFAS were detected in all sampled waterbodies, including those in rural areas that are far from any known or suspected sources of PFAS contamination. However, the range of PFAS contamination found varied widely in both fish tissue and surface water. Nearly all waterbodies in the study had PFAS concentrations in fish tissue that warrant further evaluation by MDPH on the necessity of fish consumption advisories. In addition, a few waterbodies had PFAS concentrations in surface water that warrant confirmatory sampling by MDPH to determine the safety of recreational water use.
Additional Resources
PFAS in Massachusetts Rivers (2020)
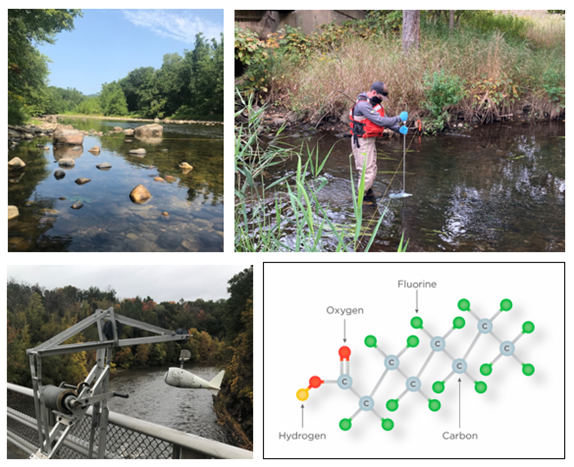
The Watershed Planning Program (WPP) collaborated with the U.S. Geological Survey (USGS) in 2020 on a water quality study to evaluate the presence of PFAS in Massachusetts’ rivers and streams. USGS conducted three rounds of sampling at each of 64 sites in 27 rivers from August to November 2020 and analyzed the samples for 24 individual PFAS. Sampling sites were located upstream or downstream of discharges from 24 wastewater treatment facilities and at 16 other stream sites, including sites downstream of suspected nonpoint and industrial sources and at sites not associated with suspected PFAS sources. PFAS were detected in all 27 of the rivers sampled. Individual PFAS concentrations ranged from not detected in the laboratory to 109 parts-per-trillion (ppt), and the sum of all 24 PFAS at a sampling location ranged between 0.3 and 399 ppt. The highest concentrations were observed downstream of wastewater effluent discharges, but PFAS were also found in rivers upstream of these discharges. The lowest concentrations were observed in rivers located in less populated areas. Multiple sources, including wastewater discharges, may contribute to riverine PFAS concentrations. MassDEP will continue to identify future monitoring objectives, potential studies, and other actions to better understand and address the distribution of PFAS in surface waters, relative contributions of different sources, and implications for public health and aquatic life.

