Revenue Estimates
To estimate potential revenue generation, EOHLC relied on transaction data from the Warren Group, which was processed and provided in summary format by PFM, a consulting group conducting a state-funded study of excise and transfer fees in Massachusetts. The data provided by PFM covers the state’s fiscal year 2022 (July 1, 2021 to June 30 2022.) PFM verified the accuracy of this data by comparing it to the current deeds excise tax revenue figures from State Auditor’s FY22 “Determination of Whether Net State Tax Revenues Exceeded Allowable State Tax Revenues.” This comparison found that the total sales volume in the data used by PFM was within 0.1% of the sales volume implied by the excise tax collections.
PFM provided EOHLC with a database of transaction counts and total dollar amounts (aka “volume”) by municipality and property type, and grouped into 18 “price bins” for sales within a specified range (e.g., $800K - $899K, $900K - $999K, etc). This database includes information about 117,229 transactions during FY22, of which 91% were classified as residential (single family and 2-3 family homes), 5.4% were classified as commercial (including industrial and apartment buildings of 4+ units), and 3.6% were unclassified.
In order to determine the exemption thresholds applicable in each county, EOHLC used 2021 median sale prices from Warren Group, shown in the table below.
Transfer Fee Exemption Thresholds, 2021
Based on the above exemption thresholds, EOHLC determined which price bins would be subject to the transfer fee for each municipality and county. For most counties, the threshold is an even $1M, which is also the threshold between the price bins of $900K - $999K and $1M to $1.5M. For Dukes and Nantucket Counties, where the threshold falls in the middle of a bin, we assumed a uniform distribution of sales within the price bin and pro-rated the count of qualifying transactions and transaction volume accordingly. Exempted volume was calculated for each price bin by multiplying the qualifying transactions times the exemption amount. The result was subtracted from total sales volume for that price bin to determine total transaction amount subject to the tax. This was multiplied by 0.01 to determine potential revenue raised by a 1% levy for each price bin and transaction type.
EOHLC estimates that 17,298 transactions – 14.8% of the total – could have been subject to the proposed transfer fee in FY2022 if it was universally applicable at the time. This includes 13.4% of all residential transactions (14,332 sales), 34.1% of commercial transactions (2,253 sales) and 12.8% of unclassified transactions (540 sales.) It should be noted that transactions that would have been exempt from the tax (e.g. transactions between government entities, between family members, pursuant to divorce) are not excluded from this analysis; however, it is likely that the number of such transactions is relatively small and their removal would not significantly affect the revenue estimates.
EOHLC estimates that if the transfer fee had been in place in all 351 cities and towns of Massachusetts in FY22, it could have raised $392M for each 1% levied. The chart below shows how this potential revenue breaks down by county and transaction type. Universal adoption of a 2% levy in FY22 would have raised an estimated $784M.

Transactions in Middlesex, Suffolk, and Norfolk County would generate more than 2/3 of the statewide revenue from a transfer tax: $271M out of the total $392M potential revenue. Meanwhile, Berkshire, Franklin, and Hampshire Counties would collectively generate only $5.4M annually, due to the much smaller number of transactions and smaller share of transactions over $1M.
Statewide, about half (52%) of the revenue would be collected from commercial transactions (including sales of apartment buildings with 4+ units). 34% of the estimated revenue is from small residential transactions (1-3 family homes), and 14% is from transactions that are unclassified in the available data. This balance varies widely across the counties. For example, Middlesex County revenue is 62% commercial transactions, whereas Suffolk County is only 39% commercial (with a higher share of unclassified transactions). Counties with a notably high share of revenue from commercial transactions include Franklin (88%), Hampden (84%), Bristol (74%) and Worcester (71%). Meanwhile, In Dukes and Nantucket County, almost 90% of the revenue is from residential transactions.
The map below shows estimated transfer tax revenue by municipality, for each 1% levy

This map shows a wide variety in potential revenue. 53 municipalities in Central and Western MA had zero transactions above the exemption threshold. Another 96 municipalities would have raised less than $100,000 in FY22 for each 1% levied. Meanwhile, 84 municipalities would have raised more than $1M in FY22, including a dozen that would have raised between $5M and $10M. Revere and Somerville could have raised $10M - $12M, Cambridge could have raised $28M, and Boston could have raised $70M with a 1% levy.
The balance of residential to commercial transactions as the source of transfer fee revenue varies widely as well. The map below shows the percentage of potential revenue coming from residential vs commercial transactions. In the municipalities colored red, the vast majority of revenue comes from commercial transactions; those in green would get the vast majority of revenue from residential transactions. The tan municipalities, such as Boston, have a relatively even split between commercial and residential revenue. (Unclassified transactions are excluded from these statistics).

Effective Tax Rates and Comparison to other Taxes
The transfer fee applies only to the transaction value above the exemption threshold. As a result, sales just above the thresholds will have very little value subject to the tax. For example, if a home is sold for $1.2M, only $200,000 will be subject to the tax; a nominal 1% levy would result in a fee of $2,000, an effective tax rate of only 0.17%. The effective tax rate increases as the transaction amount increases, resulting in a highly progressive tax structure. The chart below shows the effective tax rate of a 1% levy on transactions of each type for FY 2022.
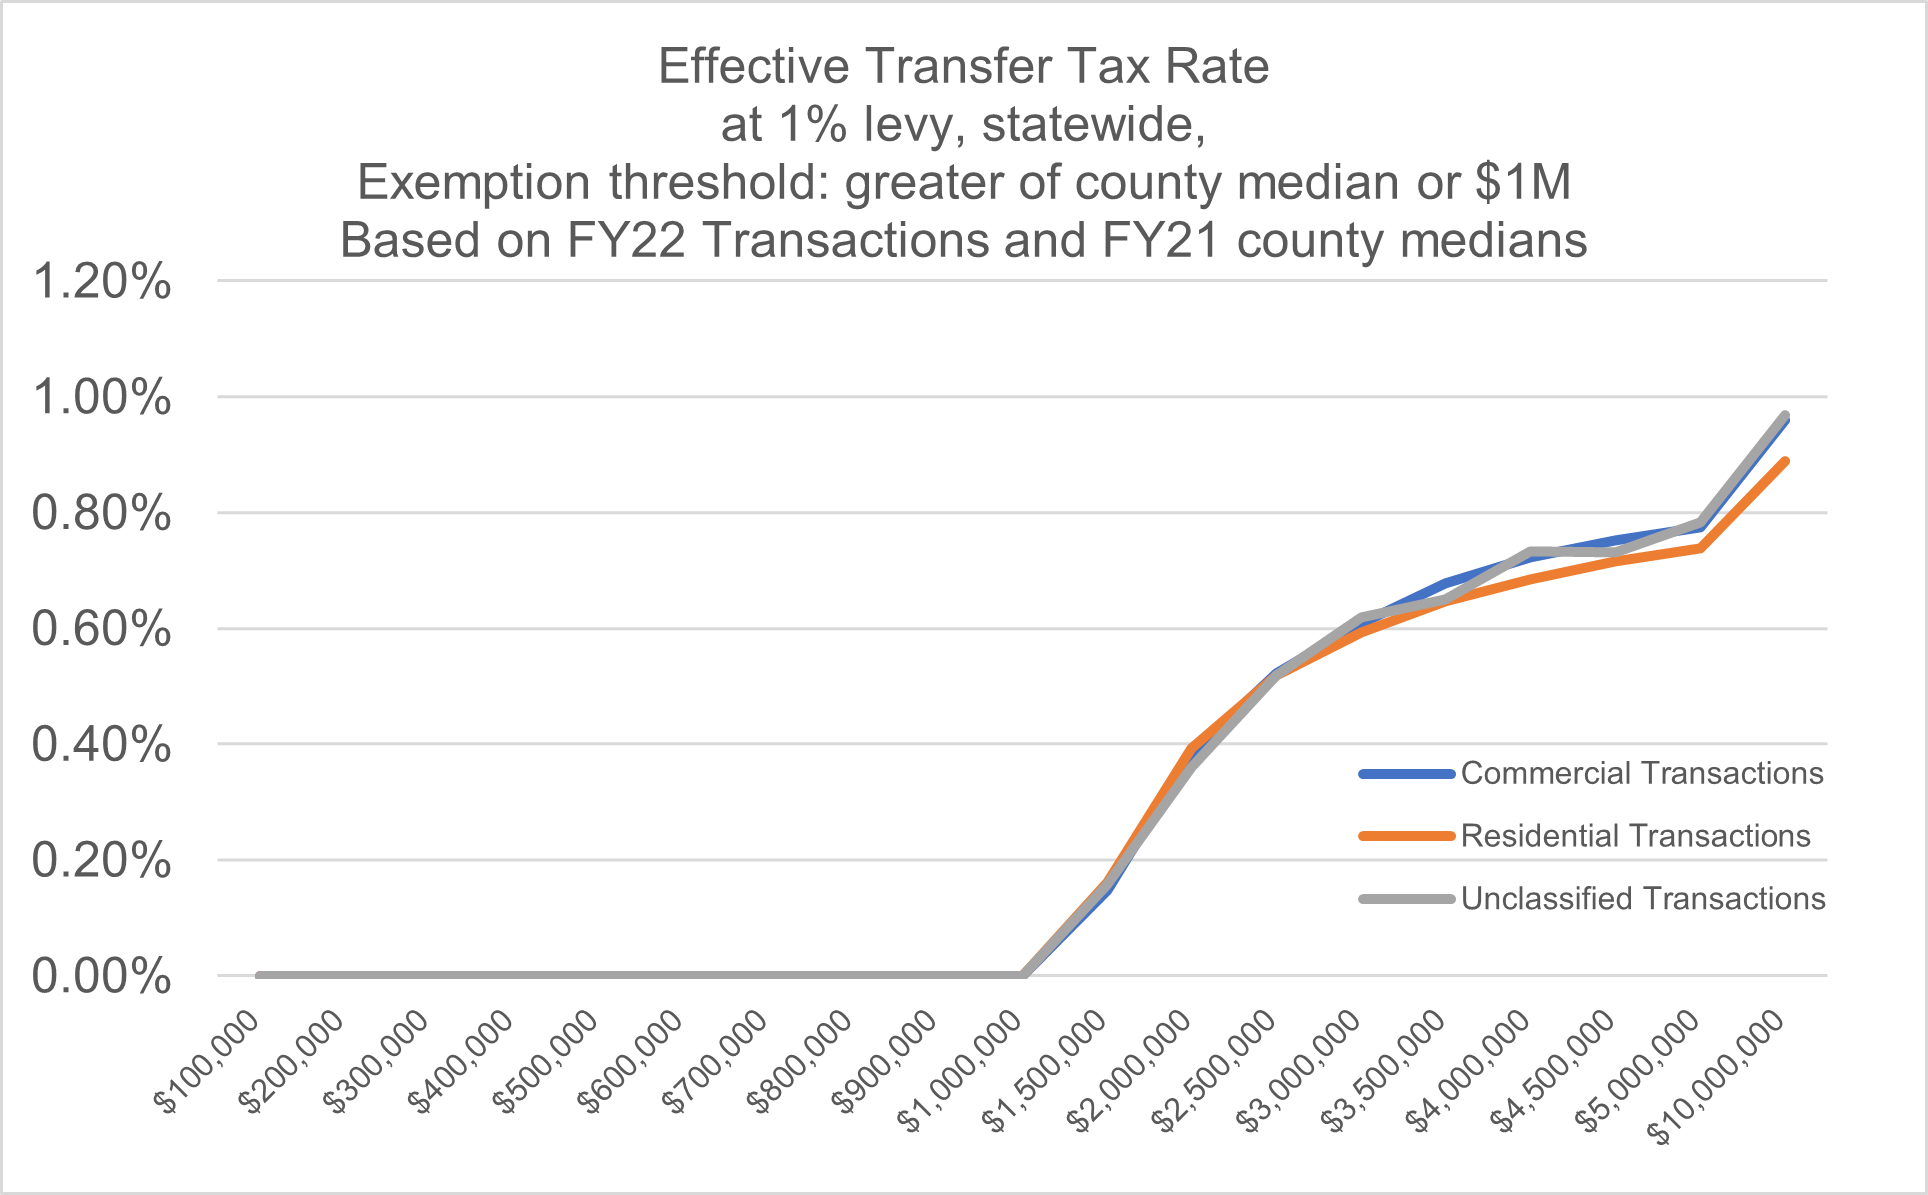
Based on the distribution of transaction amount for FY2022, EOHLC estimates that a 1% levy would result in an average effective tax rate of only 0.47% for all residential transactions over $1M. Since commercial transactions tend to have a higher transaction amount, a 1% levy would result in an average effective tax rate of 0.89% for commercial transactions over $1M.
EOHLC also found that the cost of the transfer tax would be less than a single year of property tax for the vast majority of commercial properties. The median FY23 property tax rate for commercial and industrial properties in Massachusetts is 1.55%. The commercial/industrial tax rate exceeds 2.0% in 78 municipalities, including major cities and job centers such as Boston (2.47%), Somerville, Framingham, Worcester, Marlborough, Framingham, Waltham, Burlington, Andover, Dedham, and Springfield. Even at the maximum transfer tax rate (2%), the amount levied would be less than the next year’s worth of property taxes for the vast majority of properties transacted.
Evidence about the effect of transfer fees
Massachusetts already has a statewide transfer fee, known as the Deeds Excise Tax, which is assessed at a rate of 0.456% of the total value of the transaction. Transfer taxes are levied across two-thirds of US states and many cities, though their form varies widely and their effects have not been studied extensively. Here we examine the literature and its implications for the proposed transfer fee.
One valuable point of comparison is the so-called “mansion tax” in New York state (since 1989) and New Jersey (since 2004) that applies to residential transactions of $1 million or more (and which is generally paid by the seller). Unlike the transfer tax proposed in the AHA, the 1% mansion tax is imposed on the full value of the transaction, so that a $1 million sale is subject to a $10,000 tax liability, while a $999,999 transaction is not subject to the tax at all. An analysis by researchers from Columbia University found that this discontinuity in tax liability creates a ‘cliff effect’ that causes substantial market distortions. There are more sales than expected at prices just below $1M, and an even greater number of “missing” sales at prices just over $1M. As the authors put it, the market “unravels” in the neighborhood of the eligibility threshold, resulting in an estimated 0.7% decline in the total number of residential transactions. These findings validate the AHA’s approach of a marginal transfer fee that applies only to the amount above the threshold. While a tax that applies to the full amount might raise additional revenue, it creates substantial market distortions and lost revenue due to transactions that don’t occur.
That same analysis of New York and New Jersey found that sales above $1M showed greater price discounts compared to their initial listing price than did sales below $1M, on the order of 1-2%. One explanation may be that sellers adjust their asking prices to cover the cost of the tax, but are unable to find buyers willing or able to pay the elevated price. This would suggest that the cost of the tax is effectively born by the seller. Evidence from Toronto, Germany, and Australia suggests that even when transfer fees are paid by the buyer, the tax burden largely falls on the seller. (From the Toronto study: “Our data show that Toronto’s 1.1% tax caused…a decline in housing prices about equal to the tax.”; from the Australian study: “the impact of an increase in the tax rate is to lower house prices, suggesting that the economic incidence of the tax falls on the seller.”) These findings rebut the argument that a transfer fee will drive up prices for residential buyers, who in this incredibly tight market are already paying as much as they can bear.
The studies of Toronto, Germany, and Australia also found that transfer tax tends to reduce the number of real estate sale transactions. Estimates of the reduction vary, generally ranging from 7 to 15% for each 1% fee. This could be caused by a reduction in residential mobility (people choosing not to move in order to avoid the tax); by investors choosing to defer sales due to reduced profit; or due to tax avoidance schemes (e.g., transferring controlling interest in a corporate owner of the property rather than selling the real property itself.) Where the tax is applied to all transactions, a decrease in residential mobility could be cause for serious concern; but if applied only to high-value transactions, the reduction in sales only affects the highest-income households.
Robust empirical analysis of the effects of transfer taxes on commercial transactions is even harder to come by. The San Francisco Comptroller’s analysis of a proposed increase in the transfer fee for sales over $5M speculated that an increase in the fee would not only reduce the number of transactions, but would “reduce the amount that a buyer would be willing to offer for a property, because he or she will face the higher tax liability when selling the property in the future.” As a result, it will have a tendency to discourage acquisitions made with the intent of short-term resale. In the residential real estate market, where investor activity is crowding out options for individual sales and corporate purchase of multifamily properties is creating instability for long-term tenants, a reduction in investor purchases may actually provide benefits for some segments of renters and would-be homeowners.
| Date published: | January 18, 2024 |
|---|---|
| Last updated: | January 18, 2024 |