Over the past few years small low-cost air quality sensors have become available and are being used by citizens, researchers, and states to expand local air quality monitoring. The U.S. Environmental Protection Agency (EPA) is actively engaged in evaluating air sensor performance and has initiated several air sensor pilot projects.
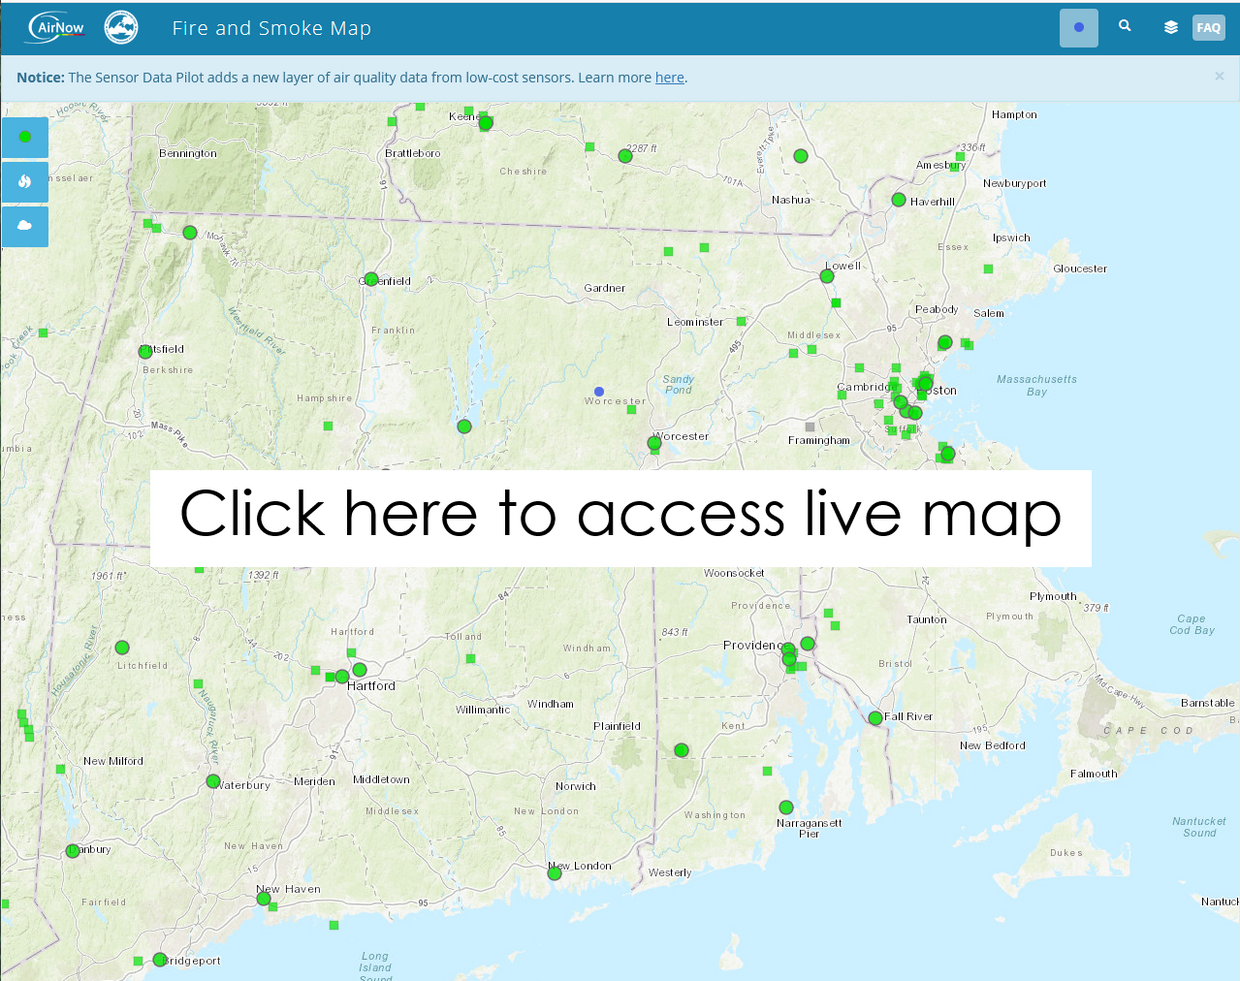
Among these projects is the AirNow Fire and Smoke Map, which shows sensor data from PurpleAir, a company that offers publicly available crowdsourced particulate matter data, together with data from regulatory PM2.5 monitors operated by state and local agencies and tribes. For more details on sensors and the data they produce see the FAQ in the upper right-hand corner of the map below.
PM2.5 is a mixture of solid particles and liquid droplets found in the air and made up of hundreds of different chemicals. PM2.5 is so small that it can be inhaled deep into the lungs and may even enter a person’s bloodstream, and can cause serious health effects. PM2.5 sensors can be used to increase understanding of local air quality and identify areas with potentially higher pollution levels where mitigation efforts can be directed to protect residents' health.
In 2021, MassDEP began providing PM2.5 sensors to communities to monitor local air quality. This effort began in Chelsea and has expanded to other communities through a MassDEP grant program that provides up to ten PM2.5 sensors to place at outdoor locations in cooperation with residents, schools, businesses, and community organizations. The data from these sensors can be seen on the map below together with data from MassDEP’s PM2.5 monitors.
About the Map
The circles on the map represent MassDEP regulatory PM2.5 monitors while the smaller squares represent PM2.5 air sensors. Clicking on any circle or square allows you to see detailed air quality information from that monitor or sensor.
Monitor and sensor color indicates current air quality based on EPA’s Air Quality Index. For a legend of the colors and other helpful information about the map click the FAQ box at the top right of the map.
The Fire and Smoke Map was created in response to the increasing number and severity of wildfires in the U.S. The data from these sensors has helped the public to stay informed and take actions to avoid unhealthy air. While Massachusetts is less prone to wildfires, the sensors measure PM2.5 from all sources and provide PM2.5 data on local air quality.
Note that while air sensors provide useful air quality data they do not have the precision and accuracy of the laboratory-grade monitors used by MassDEP and other regulatory agencies to monitor air quality.