- Executive Office of Labor and Workforce Development
Media Contact
Matthew Kitsos, Deputy Chief of Staff & Director of Communications
MASSACHUSETTS — Massachusetts Weekly Unemployment Claimant Data
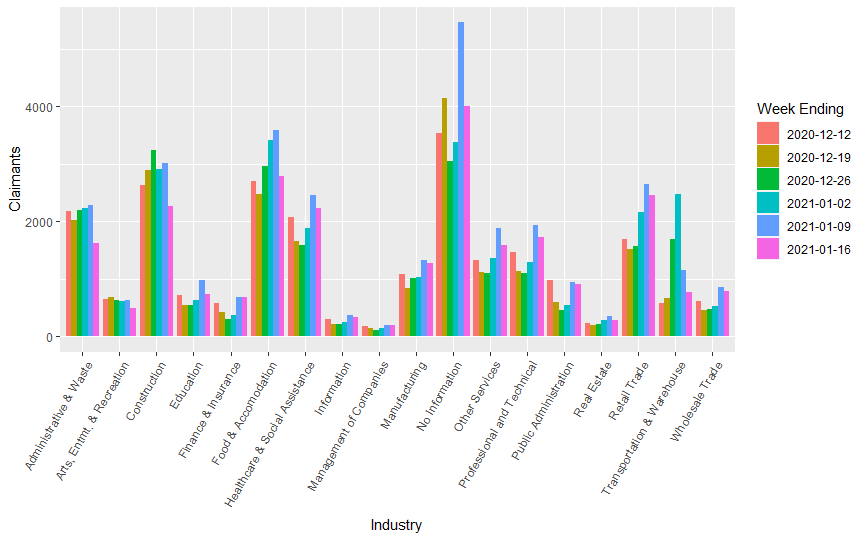
From January 10 to January 16, 2021, Massachusetts had 25,485 individuals file an initial claim for regular Unemployment Insurance (UI), a decrease of 5,608 over the previous week. Decreases in initial claim filings were seen in almost all the sectors. The largest decreases in filings were seen in the Information Not Available sector (either lacking industry or employer information), down 1,441; Food and Accommodation, 789 less; Construction, 738 fewer; and Administrative and Waste Services which decreased by 665. Since March 15, a total of 1,831,832 initial claims for regular UI have been filed. Continued weeks claimed for the week ending January 16 at 164,742 were just 85 less than the previous week.
The Pandemic Unemployment Assistance (PUA) program for week ending January 16 had 6,351initial claims filed, an increase of 1,681 over the previous week. A total of 913,358 claimants have filed an initial claim for the PUA since April 20, 2020. PUA continued weeks claimed for the week ending January 16, at 515,913, was an increase 258,422 from the previous week. The increase in continued weeks filings was due to the Continued Assistance Act which extended PUA eleven more weeks effective week ending January 2, 2021.
The Pandemic Emergency Unemployment Compensation (PEUC), which provided up to 13 weeks of extended benefits, was implemented on May 21. PEUC initial claims filed at 7,196 was a decrease of 2,934 over the previous week. Since implementation, PEUC filings now total 382,305.
The federal/state Extended Benefits (EB) program, which triggered on May 3 due to the high volume of claims, for the week ending January 16 had 14,788 initial claims filed. Since the week of September 6, the first week EB claims were filed, a total of 524,529 claimants filed an EB initial claim.
| Initial Claims Filed | ||||
|---|---|---|---|---|
| Industry | Week Ending 1/9 | Week Ending 1/16 | Change | % Change |
| Agriculture, Forestry, Fishing and Hunting | 194 | 161 | -33 | -17.0% |
| Mining | 26 | 23 | -3 | -11.5% |
| Utilities | 51 | 54 | 3 | 5.9% |
| Construction | 3,009 | 2,271 | -738 | -24.5% |
| Manufacturing | 1,335 | 1,280 | -55 | -4.1% |
| Wholesale Trade | 862 | 795 | -67 | -7.8% |
| Retail Trade | 2,642 | 2,457 | -185 | -7.0% |
| Transportation & Warehouse | 1,159 | 770 | -389 | -33.6% |
| Information | 364 | 336 | -28 | -7.7% |
| Finance & Insurance | 676 | 677 | 1 | 0.1% |
| Real Estate | 354 | 291 | -63 | -17.8% |
| Professional and Technical Services | 1,929 | 1,722 | -207 | -10.7% |
| Management of Companies | 204 | 192 | -12 | -5.9% |
| Administrative & Waste Services | 2,292 | 1,627 | -665 | -29.0% |
| Education | 975 | 740 | -235 | -24.1% |
| Health Care & Social Assistance | 2,453 | 2,228 | -225 | -9.2% |
| Arts, Entertainment & Recreation | 634 | 499 | -135 | -21.3% |
| Food & Accommodation | 3,584 | 2,795 | -789 | -22.0% |
| Other Services | 1,893 | 1,589 | -304 | -16.1% |
| Public Administration | 952 | 914 | -38 | -4.0% |
| Information Not Available | 5,505 | 4,064 | -1,441 | -26.2% |
Initial claims by industry
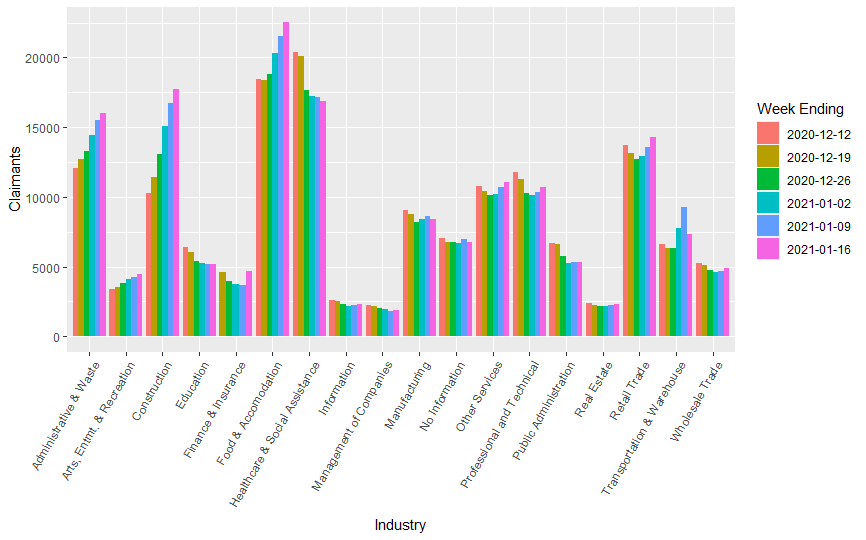
Continued weeks claimed by industry
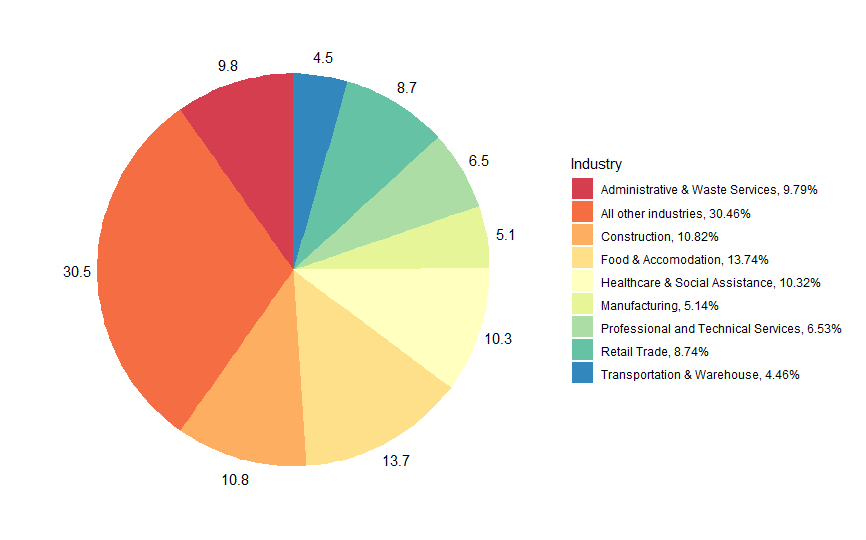
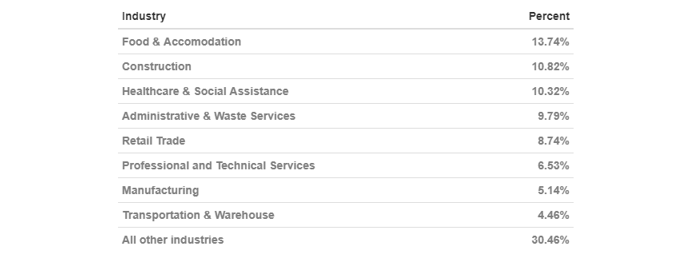
Industry share of CWC in most recent week
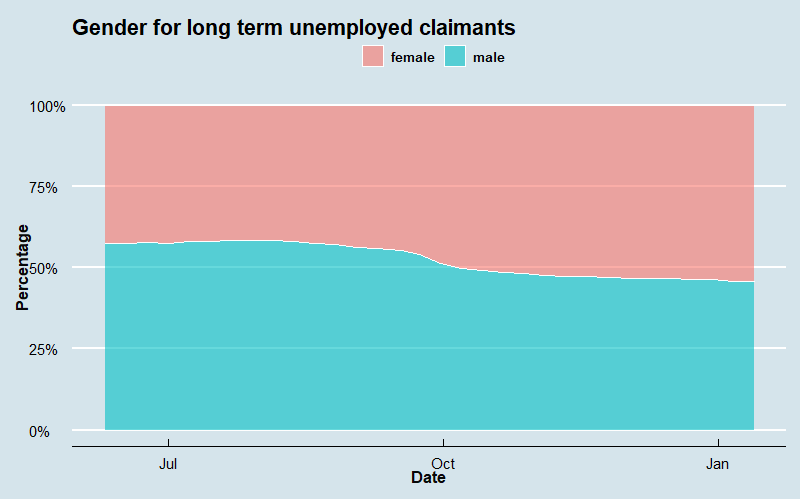
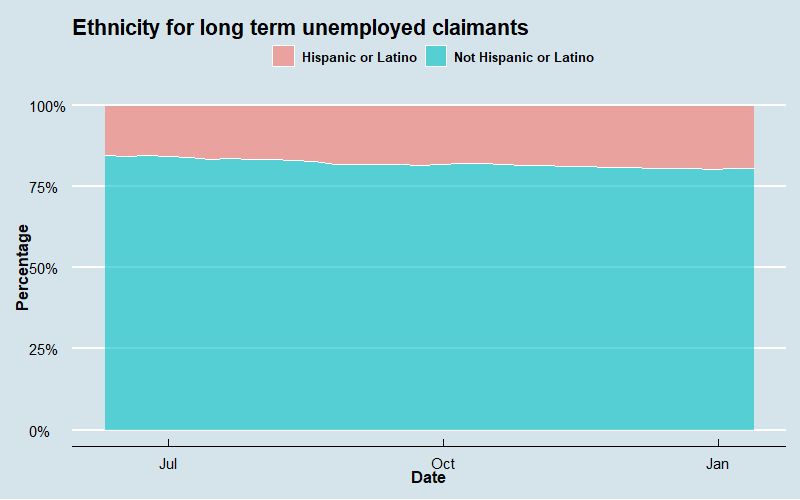
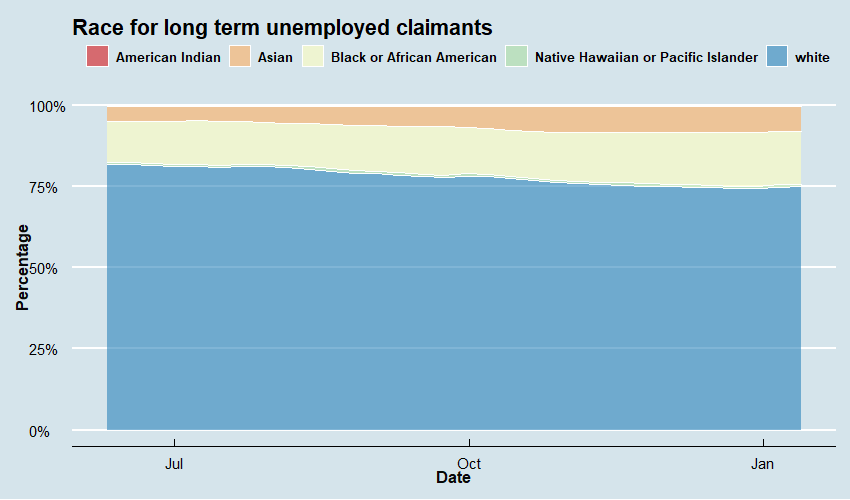
Demographic Breakdowns
Below we present demographic statistics on ethnicity, gender, and race for all those claimants who filed for a continued week in the period prior to the above information. This is to say that because of the timing of data availability, the below statistics reflect continued weeks claimed in the week ending January 9th rather than the week ending January 16th.
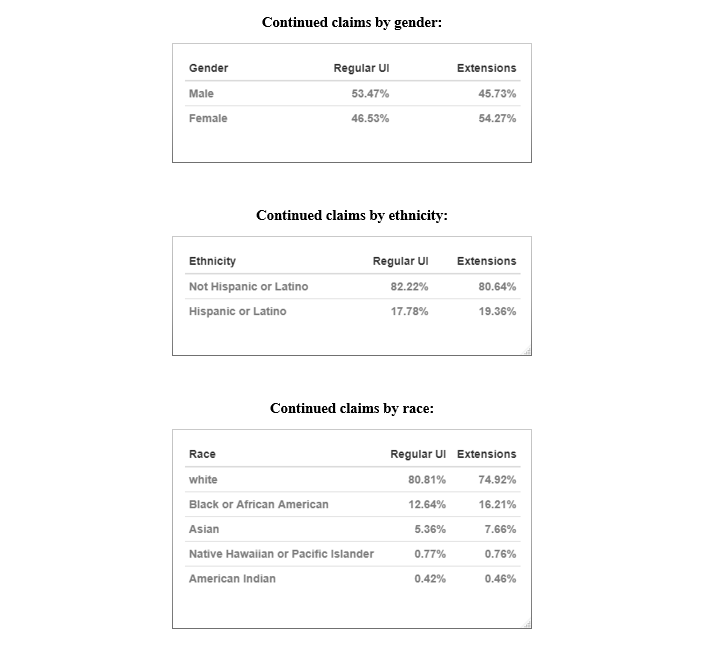
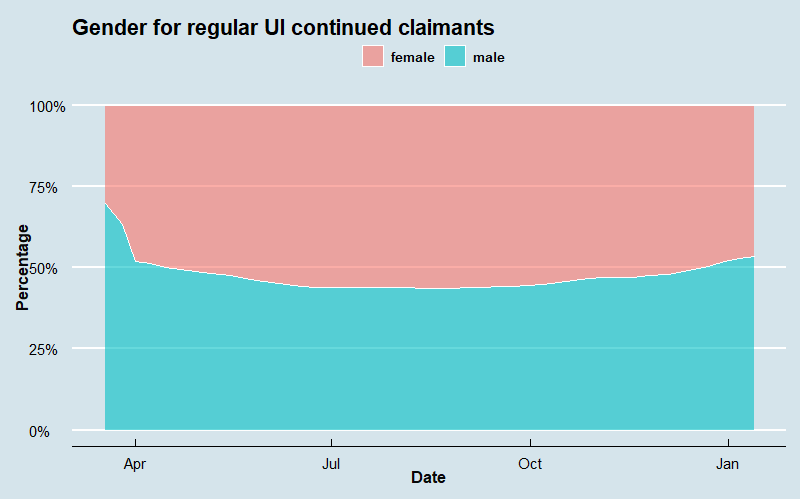
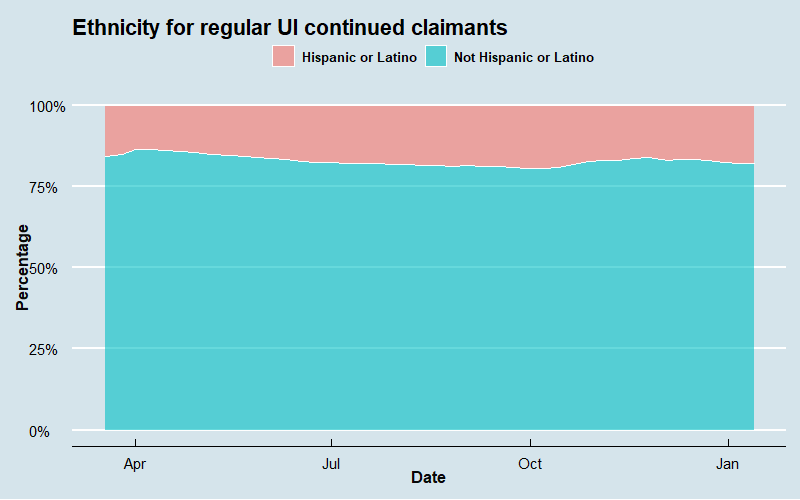
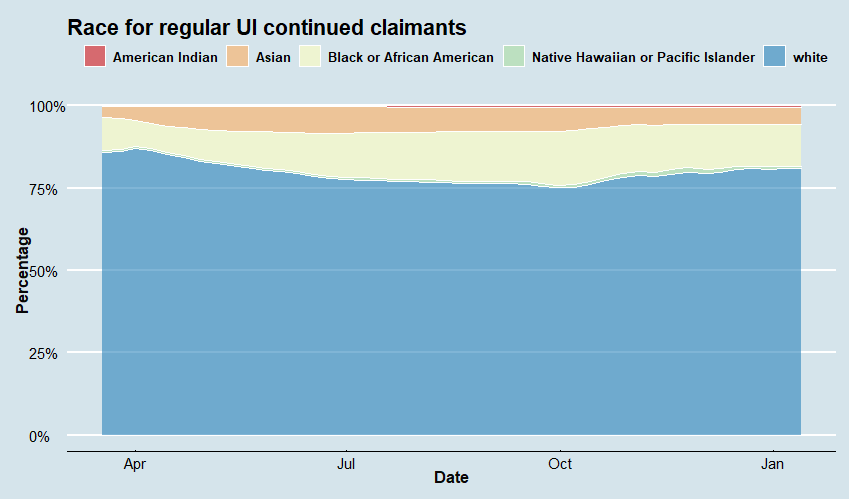
Regular UI Demographic Series
Here we present the breakdown by gender, ethnicity, and race of continued claims for Regular UI between March 8th and January 9th, 2021:
###