1.1 ACO Composition and Governance Structure
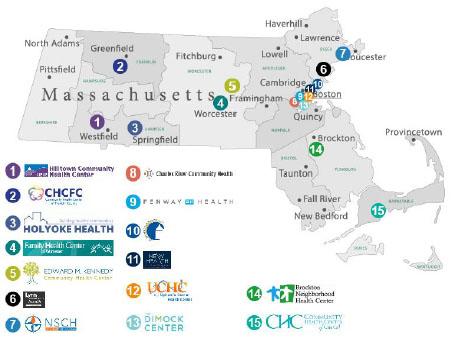
Community Care Cooperative (C3) is a Primary Care Accountable Care Organization (ACO) comprised of 15member federally qualified health centers (FQHCs) that collectively govern our organization.C3 was established for the sole purpose of participating as an ACO in the Executive Office of Health and Human Services’ (EOHHS) MassHealth ACO Program. C3FQHCs, listed below, are geographically dispersed and serve a diverse population with a high concentration of Medicaid patients:
- Brockton Neighborhood Health Center
- Fenway Health
- Charles River Community Health
- Hilltown Community Health Center
- Community Health Center of Cape Cod
- Holyoke Health Center
- Community Health Center of Franklin County
- Lynn Community Health Center
- The Dimock Center
- North End Waterfront Health
- East Boston Neighborhood Health Center
- North Shore Community Health
- Edward M. Kennedy Community Health Center
- Upham’s Corner Health Center
- Family Health Center of Worcester
C3 governance is organized around a Board of Directors and includes the following six committees: 1) an Executive Committee, a subset of the board with more limited authority than the full Board; 2) a Patient Family and Advisory Committee (PFAC); 3) a Quality Committee, which includes representation from primary care, mental health, and substance use disorder treatment providers; 4) a Finance Committee; 5) an Audit Committee; and 6) a Compliance Committee. The committees ensure that all fiduciary, clinical, quality, and compliance activities and responsibilities are fully and thoroughly identified, implemented and monitored.
The board composition includes a consumer advocate, C3’s CEO, and two directors from each C3 FQHC: the FQHC chief executive officer (CEO) and chief medical officer (CMO), if the CMO is a practicing PCP. (If a CMO is not a practicing PCP, the board seat would be held by a medical director who is a practicing PCP.)
C3’s Quality Committee, Finance Committee, and Board of Directors are involved in all DSRIP-related decision-making, including priority setting, development of C3’s DSRIP Policy, and establishing annual budgets for all DSRIP and non-DSRIP spending.
1.2 ACO Population Served
C3 expects to serve 121,865 MassHealth members (per DSRIP PY1 Funding Notification Letter).
C3 FQHCs serve a large number of communities across the Commonwealth, from densely populated downtown Boston to the Cape and to rural areas in western Massachusetts. Our partners are located across all five MassHealth-defined regions of the state as shown below.
While all C3FQHCs primarily serve low-income, underserved, and increasingly diverse populations, each region of the state has distinct demographic characteristics that drive unique physical health, behavioral health, social and functional needs. Brief snapshots of each of the communities our FQHCs serve, organized by MassHealth’s five regions, are provided below.
| Greater Boston Region | |
|---|---|
|
The Dimock Center |
|
| Demographics: Service Area.: 55% White, 21% Black | Other Salient Characteristics:High poverty rates; an estimated 64% of patients have incomes at or below 100% of FPL |
| East Boston Neighborhood Health Center (EBNHC) | |
| Demographics: Service Area: 70% between the ages of 18-64; 67% whiteAmong EBNHC’s current patients, over 58% are best served in a language other than English. | Other Salient Characteristics:High unemployment rates and increasing rates of homelessness; nearly ¼ of adults do not have a high school diploma |
| Fenway Health | |
| Demographics: Service Area: 70.1% White, 14.5% Asian/Pacific Islanders, 13.7% Black; Hispanic or Latino ethnicity: 14.1%. Among Fenway Health’s current patients, 41% are between ages 18-29 | Other Salient Characteristics:High poverty rates for Hispanic, Asian and Black populations. Stigma and discrimination create access to care barriers for LGBTQ populations |
| North End Waterfront Health (NEWH) | |
| Demographics: Service Area.: 55% White, 21% BlackNote: NEWH’s Charlestown site opened 12/15/2015 changing the demographics and needs of NEWH’s current patient base. | Other Salient Characteristics: Most significant concerns: Charlestown has the highest Hepatitis C prevalence of all Boston neighborhoods and is 2ndin opioid-related hospital admissions. |
| Upham's Corner Health Center | |
| Demographics: Service Area: 56% Black, 21% white; 33% born outside of the U.S.; 19% between ages 25 and 64; 41% speak language other than English at home | Other Salient Characteristics:The area has the highest homicide rates in Boston and higher non-fatal violence rates than other Boston neighborhoods. More than ¼ of the population lives at or below the poverty line. |
| Northern Region | |
|---|---|
| Lynn Community Health Center (LCHC) | |
| Demographics: Service Area: Non-white population 66%; 34% HispanicAmong LCHC’s currentpatients,53.3% are best served in a language other than English | Other Salient Characteristics:High rates of unemployment and poverty, low educational attainment, low median income, and substantial housing affordability issues |
| North Shore Community Health (NSCH) | |
| Demographics: Service Area: Fewer young children and youth under age 18; 18.6% Hispanic Among NSCH’s current patients, 35% best served in a non-English language (predominantly Spanish and Portuguese) | Other Salient Characteristics:High rates of poverty and uninsured |
| Southern Region | |
|---|---|
| Brockton Neighborhood Health Center | |
| Demographics:Service Area: 44.2% White; ¼ of population is foreign-born (10% in Africa); 37.1% non-English speaking | Other Salient Characteristics:Violence, lack of access to exercise, low literacy and housing access |
| Community Health Center of Cape Cod (Cape Cod) | |
| Demographics: Service Area: 58.7% white, 4.7% black; 6% use English as a second language; 2.7% veterans | Other Salient Characteristics:Low income (annual wages are 32% lower than state average) and lack of specialty care access |
| Central Region | |
|---|---|
| Charles River Community Health | |
| Demographics: Service Area: 70+% White, 5%+ Black; 14%+ HispanicAmong Charles River’s current patients, 55% require translation during appointments | Other Salient Characteristics:Low rate of insurance; financial barriers for filling prescriptions; poor access and financial barriers to health and food |
| Community Health Center of Franklin County (CHCFC) | |
| Demographics: Service Area: 94.1% white, 1.6% Asian; 31.5% ages 18-44; 9.1% less than high school graduate | Other Salient Characteristics:High rates of poverty; housing insecurity; transportation; and food deserts |
| Edward M. Kennedy CHC and Family Health Center of Worcester (FHCW) | |
| Demographics: Service Area: 49% Whitenon-Hispanic, 22% Hispanic, 12% Black; 42% of individuals in the service area live at 199% of poverty level or below | Other Salient Characteristics:High rates of poverty among a population where 38% are school-aged children |
| Western Region | |
|---|---|
| Holyoke Health Center (HHC) | |
| Demographics: Service Area: 48.4% Hispanic; 30% under the age of 18 | Other Salient Characteristics:High rates of poverty |
| Hilltown Community Health Center (HCHC) | |
| Demographics: Service Area: 97.7% White; elderly individuals represent 21.3% of the area population. | Other Salient Characteristics:Low population density, geographic isolation, pockets of rural poverty and few opportunities for local employment. |
1.3 Overview of DSRIP Investment Approach
Population Health Management
C3’s population health strategy is to build on our greatest asset: the foundational capabilities of our FQHCs’ patient-centered medical homes (PCMH). The core of this strategy is to strengthen and enhance the population management capabilities of our C3 PCMHs for the approximately 95% of members who do not have complex behavioral health (BH) or physical health needs. For the approximately 5% of most complex members, C3 has proven care management programs and dedicated care management capacity. Care management will vary for the subpopulations that make up this “most complex” group. In all cases, these care management teams will be embedded in the FQHCs, working with members’ primary care and behavioral health providers and coordinating with Community Partners (CPs).
Provider Accountability
C3 requires meaningful financial accountability for cost of care and quality among all C3 health centers. C3’s goals for its value-based payment arrangement, the Internal Financial Architecture (IFA), are to:
- Motivate FQHCs to work toward C3’s total cost of care (TCOC) and quality goals
- Allow FQHCs to take risk and reward appropriate to their risk tolerance and financial position
- Ensure C3 meets its financial obligations under a wide range of scenarios.
C3’s current risk tiers are described in the table below. IFA shared savings and shared losses calculations follow the EOHHS Primary Care ACO, Track 2 gain and loss sharing formula outlined in the Model Contract.Then,C3 and health centers participate in those savings and losses according to the chosen tier.
Risk Tier Calculation
High Accountability
75% of shared savings or shared losses associated with shared savings (calculated per EOHHS formula for a given performance year) for attributed Enrollees up to a maximum difference of +/-10% from benchmark (10% is the “exposure cap”)
Medium Accountability
50% of shared savings or shared losses associated with shared savings for attributed Enrollees up to a maximum difference of +/-5% from benchmark
Low Accountability
30% of shared savings or shared losses associated with shared savings for attributed Enrollees up to a maximum difference of +/-3% from benchmark
Total Cost of Care (TCOC) Management
C3’s approach to TCOC management uses data from a wide variety of sources, predictive analytics, and workflow tools to drive assessment, care planning, and team-based care management to lower the total cost of care. We are aggregating a large amount of data, most notably very complete EHR data extraction through a market-leading technology vendor in this space (Arcadia) and ADT feeds for physical and behavioral health admits through hospital relationships, a well-regarded clearinghouse (MAeHC) and MBHP. This data is analyzed to identify individuals who are mostat risk and most impactable. Most notable here, C3 expects to stratify 1-2% of the population at one time (~5% annually) into its complex care management program and 30% of all physical health inpatient admits and 100% of all BH inpatient admits into its transitions of care program. Finally, the work of care teams in these and other programs will be driven by analytics and managed through C3’s care management software, Identifi.
Path to Sustainability
By investing upfront in IT resources and programs to strengthen primary care and manage TCOC, C3 expects to generate shared savings. In addition, C3 will explore ways to bring value to health center patients in other insurance programs and thereby leverage its core data and programmatic assets and diversify its funding sources and risk portfolio.
DSRIP Investment Strategy
Three principles drive C3’s vision and strategy for use of DSRIP funds:
Build on Existing FQHC Investments in Primary Care. C3 FQHCs have made significant investments in primary care aligned with national standards (e.g. PCMH certification) and attuned to the needs of the communities they serve. C3 investments will use DSRIP funds, including novel funding streams like flexible services funds, to leverage this strength to improve primary care and the health of communities. These improvements will be one key component to reduce medium-and long-term health care costs for C3 Enrollees.
Make New Investments to Guide Resource Use. C3 will make new investments in data, analytics, and workflow to focus scarce care coordination, care management, and care transitions resources where they can have the greatest impact on quality and cost. C3’s new investments in these areas, combined with the incentives in C3’s value-based payment arrangement, will drive more efficient and effective use of resources.
Make Consistent, At-Scale Investments in Care Coordination, Care Management, and Care Transitions. C3 will make investments in care coordination, care management, and care transitions at a scale and consistency that exceeds what most primary care providers, including C3 FQHCs, have achieved to date through grants and internally-funded initiatives. These more effective programs –focused on individuals who could benefit most –will be another key to reducing health care costs for C3 Enrollees.
Anticipated Challenges
As a new organization working in an evolving Medicaid delivery system, we are prepared to face many challenges as we implement and manage ACO initiatives. Two important challenges that willrequire significant resources and collaboration with external parties include:
Achieving Consistency across FQHCs. Each of C3’s FQHC’s has local approaches to service delivery based on population served and the history of the organization. However, we believe that certain systems, policies and procedures, and work flows need to be consistent across the network, and will require changes in culture, processes and technology to achieve our goals. We are confident that our governance structure, our planned infrastructure, and our staff are capable of addressing this challenge.
Effectively Leveraging MassHealth Infrastructure and Capabilities. C3 must work closely with EOHHS and its vendors to ensure we are leveraging MassHealth’s infrastructure and capabilities. We are already leveraging data generated by MBHP in our transitions of care program. We believe there are significant opportunities working with MassHealth in this area.