How Massachusetts Heats
Natural gas is currently the dominant heating source for homes in Massachusetts, although clean heating technologies have advanced in the Commonwealth with air source heat pumps leading the way. Air-source heat pumps are a more efficient and cost-effective way to heat your home using electricity. As a result, an increasing number of Massachusetts’ households are installing air-source heat pumps and incentives are available through the Commonwealth’s Mass Save® energy efficiency programs. Additional information on heating technologies can be found on the Massachusetts Household Heating Costs webpage.
The U.S. Census Bureau reports occupied housing units by heating fuel. The latest American Community Survey estimate for 2024 is summarized in Figure 1 and Table 1 below. The U.S. Census Bureau provides a definition of occupied housing units and explains the count of occupied housing units is the same as the count of households. For convenience, DOER uses the term households when referring to the ACS data.
Figure 1. Massachusetts Household Heating by Fuel (2024)
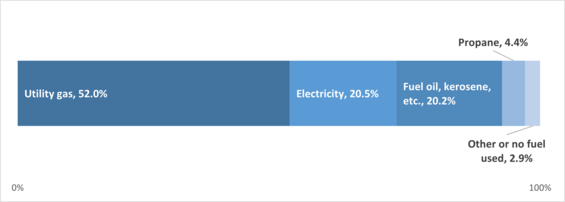
Table 1: Massachusetts Household Heating by Fuel, Count and Percentage
| Fuel Type | # of Households | Percentage |
|---|---|---|
| Utility gas | 1,472,791 | 52% |
| Electricity | 578,927 | 20.5% |
| Fuel oil, kerosene | 572,376 | 20.2% |
| Bottled, tank, liquified petroleum | 124,926 | 4.4% |
| Wood | 29,933 | 1.1% |
| Other fuel | 21,569 | 0.8% |
| No fuel used | 18,606 | 0.7% |
| Solar | 9,004 | 0.3% |
| Coal or coke | 1,672 | 0.1% |
| Total | 2,829,804 |
Source: U.S. Census Bureau, 2024, American Community Survey 1-year estimates
How New England Heats
In New England as a whole, a smaller share of households heat their home using natural gas. Heating oil remains the second most prominent heating fuel, behind natural gas. Lack of natural gas infrastructure in Maine, Vermont, and parts of New Hampshire means less access to gas supplies. Several New England states offer incentives for high efficiency electric heating technologies which is increasing conversion from oil-sourced heating to air-source heat pumps. Figure 2 and Table 2 summarize ACS data for New England, which includes Massachusetts, Connecticut, Maine, New Hampshire, Rhode Island, and Vermont.
Figure 2. New England Household Heating by Fuel (2024)
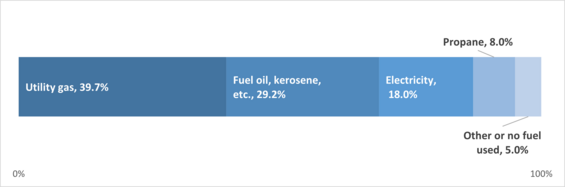
Table 2: New England Household Heating by Fuel, Count and Percentage
| Fuel Type | # of Households | Percentage |
|---|---|---|
| Utility gas | 2,473,000 | 39.7% |
| Fuel oil, kerosene | 1,817,543 | 29.2% |
| Electricity | 1,121,111 | 18% |
| Bottled, tank, liquified petroleum | 500,334 | 8% |
| Wood | 174,016 | 2.8% |
| Other fuel | 59,169 | 1% |
| Solar | 41,703 | 0.7% |
| No fuel | 33,999 | 0.5% |
| Coal or coke | 2,954 | 0% |
| Total | 6,223,829 |
Source: U.S. Census Bureau, 2024 American Community Survey 1-year estimates