- In 1993, an estimated 3.9% of Massachusetts residents had diabetes.
- By 2015, an estimated 8.9% of Massachusetts residents had diabetes — more than double the amount in just 22 years.
- Black non-Hispanic Massachusetts residents (12.3%) and Hispanic Massachusetts residents (11.7%) have higher rates of diabetes compared to White non-Hispanic Massachusetts residents (8.7%).
- Diabetes prevalence increases with age, 18.5% and 22.8% in the 65-74 and 75+ age groups afflicted, respectively.
- Black non-Hispanic Massachusetts residents have greater than twice the rate of diabetes related mortality compared to White non-Hispanic Massachusetts residents and more than four times as many diabetes related emergency department visits.
Trends in Diabetes Prevalence in Massachusetts
The prevalence of diabetes in Massachusetts has been steadily rising. In 1993, an estimated 3.9% of Massachusetts residents had diabetes. By 2015, an estimated 8.9% of Massachusetts residents had diabetes - more than double the amount in just 22 years.
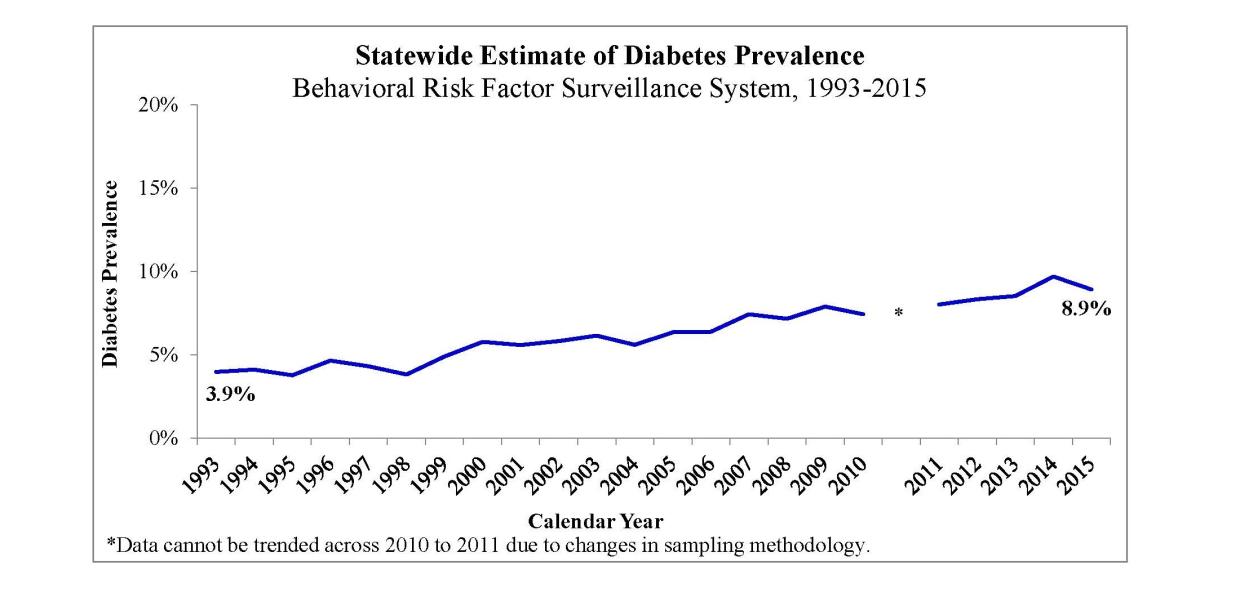
Massachusetts Behavioral Risk Factor Surveillance System, 2015
- Behavioral Risk Factor Surveillance System (BRFSS), maintained by the Massachusetts Department of Public Health, Bureau of Health Statistics, Research and Evaluation.
- Adults (18+) only.
- Data cannot be trended from 2010 to 2011 due to changes in survey methodology.
Prevalence of Diabetes by Race and Ethnicity in Massachusetts (2015)
People of color living in Massachusetts have higher rates of diabetes compared to White non-Hispanics living in Massachusetts.
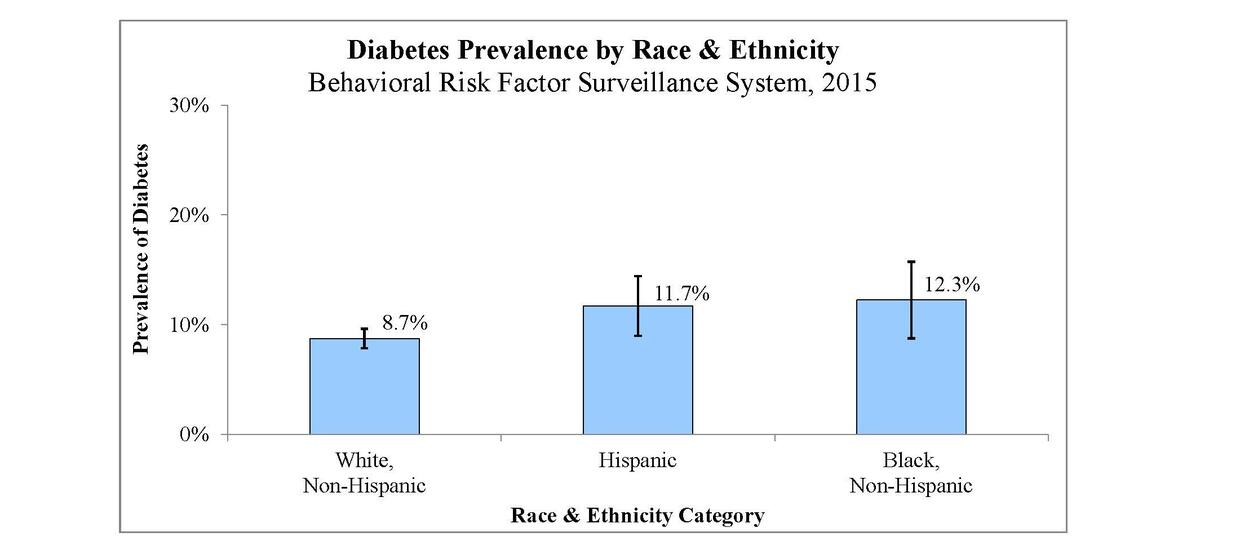
Massachusetts Behavioral Risk Factor Surveillance System, 2015
- Rates for Asian Indian, Chinese, Filipino, Japanese, Korean, Vietnamese, Native Hawaiian, Guamanian/ Chamorro, Samoan, and other racial categories not reported due to insufficient sample size.
- 95% Confidence Interval.
- Adults (18+) only.
Prevalence of Diabetes in Massachusetts by Age Group (2015)
Diabetes prevalence increases with age.
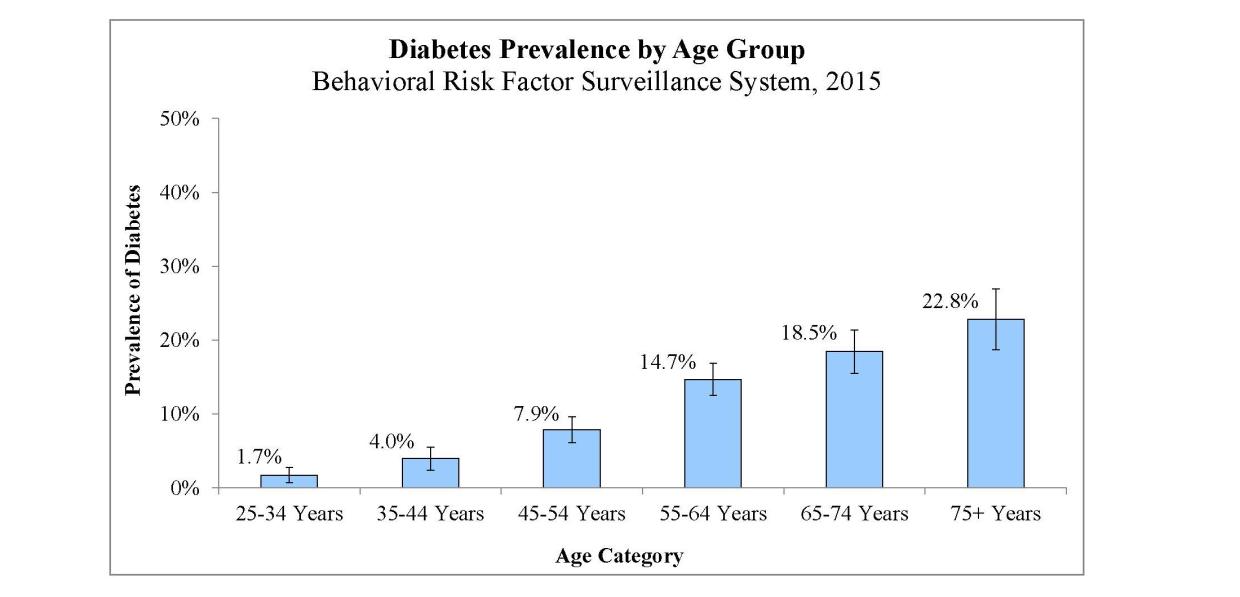
Massachusetts Behavioral Risk Factor Surveillance System, 2015
- 95% Confidence Interval.
- The 18 to 24 age group not reported due to insufficient sample size.
- Adults (18+) only.
Diabetes Morbidity/Mortality in Massachusetts
Black non-Hispanic Massachusetts residents have greater than twice the rate of diabetes related mortality compared to White non-Hispanic Massachusetts residents.
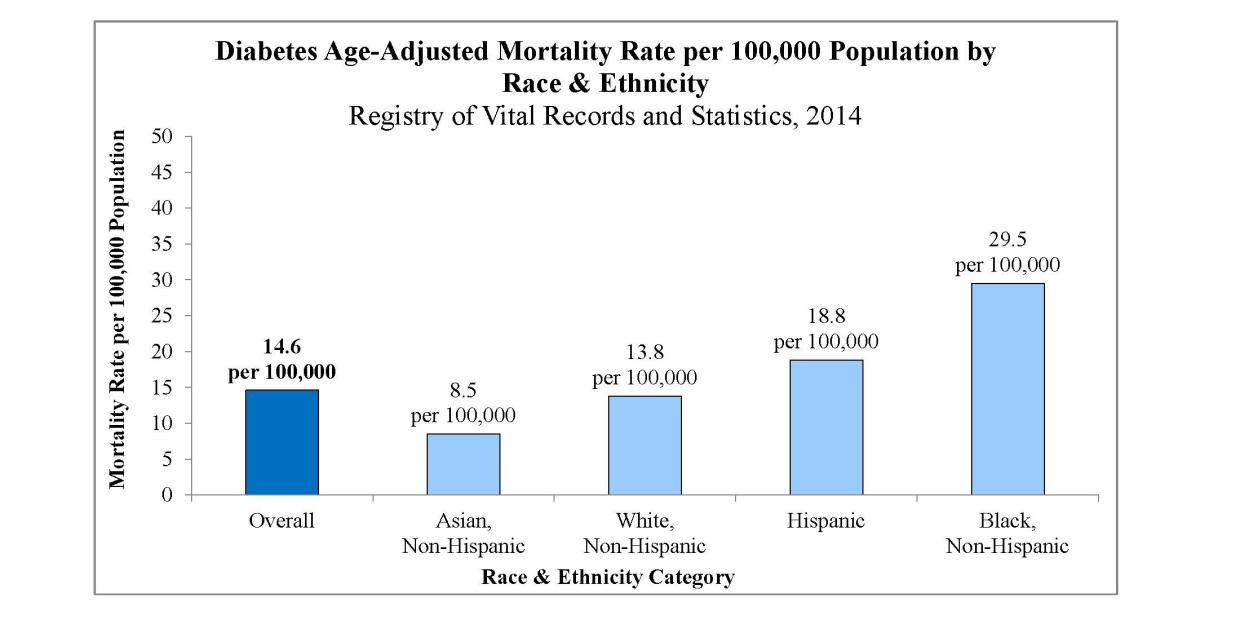
Massachusetts Deaths 2014. Boston, MA: Office of Data Management and Outcomes Assessment, Massachusetts Department of Public Health. October 2016.
- Underlying Cause of Death based on ICD-10 code.
- All rates are age-adjusted per 100,000 residents using the 2000 US standard population.
Diabetes Emergency Department Utilization in Massachusetts (2013)
In 2013, the diabetes emergency department visit rate among Hispanic Massachusetts residents was over three times as high as White non-Hispanic Massachusetts residents, whereas Black non-Hispanic Massachusetts residents had over 4 times the diabetes emergency department visit rate as White non-Hispanic Massachusetts residents.
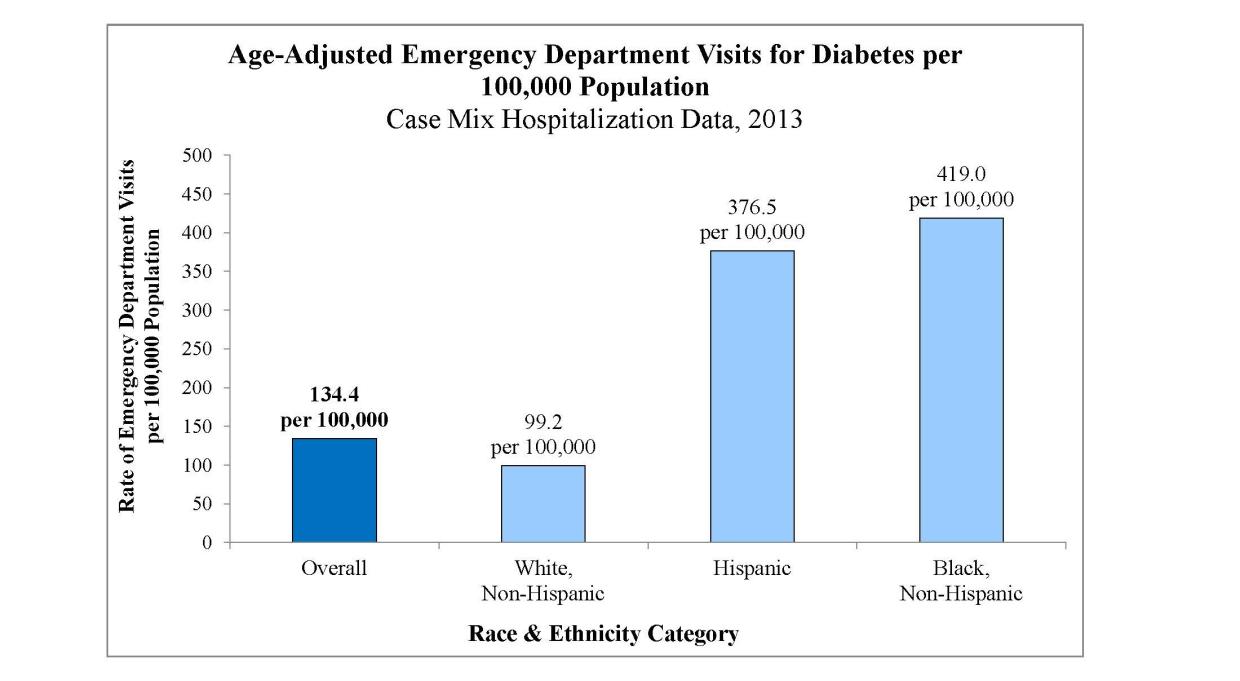
Case Mix Hospitalization Data, 2013
- Emergency department visits due to diabetes (ICD-9 code).
- All rates are age-adjusted per 100,000 residents using the 2010 US standard population.