Supported browsers for Power BI
According to Microsoft Power BI documentation, Power BI supports these browsers on all platforms:
- Microsoft Edge
- Chrome desktop latest version
- Safari Mac latest version
- Firefox desktop latest version
Note: Power BI doesn't run in any browsers in iOS10 or previous versions.
The user experience for interacting with the Power BI dashboard is generally better on desktop than on mobile devices.
For screen reader users
Screen reader users may encounter difficulties using Power BI dashboards. Dashboard visualizations don't present information in comprehensive manner, and offer limited interactions.
You might have a better experience by skipping a dashboard, reading the information on the page to get the context of the presented data in the dashboard, then browsing the data through the data table as an alternative presentation to the dashboard.
If you wish to proceed to a dashboard, use Power BI keyboard commands to navigate and interact with elements in a dashboard. Please keep in mind that interaction could be limited.
Screen reader interaction with data visualization elements
Screen readers might pick up on some elements in a data dashboard but content announced by them might not be comprehensive to you because of lack of contextual information. Interactive dashboards are currently too complex for modern assistive technology. For example, screen readers usually cannot associate data points with the x-axis and y-axis. Some features in a data visualization might be only available as visual effects that are not translated to text information that screen readers can recognize.
This is currently a common issue with many data visualization software.
Identify dashboards
Dashboards are embedded in the page as iframes. Dashboard iframes have titles generated by Power BI. When you reach iframes, your screen readers announce the titles and you'll get some idea of what they are about before accessing the dashboards.
For JAWS users
JAWS has the Frames List feature (INSERT + F9). You can take advantage of the feature to quickly find and access a dashboard iframe by title.
Navigate and interact with Power BI dashboards
Power BI has a unique set of keyboard commands that are not necessarily aligned with universal keyboard commands for keyboard, screen readers, and other assistive technologies you are accustomed to.
Using a keyboard command for a feature that doesn’t match with Power BI’s could cause unexpected results, for example, the feature doesn’t get triggered (no response), or an unintended feature gets triggered. Please refer to the list of frequently used keyboard commands. You can see the full list of their keyboard commands in Microsoft Power BI documentation.
Access a dashboard from the main page
- Confirm you reach a dashboard before using the keyboard command to enter it;
- sighted keyboard users see a black or blue outline appears around the dashboard as a focus indicator
- when screen readers reach the iframe where the dashboard is embedded, they tell you that's an iframe along with the title of the dashboard or may also announce "Power BI report" or "Application." JAWS users hear "list of three items" instead of the indication of the iframe.
- Then, press CTRL (CMD for Mac) + ENTER.
- Three menu items are presented:
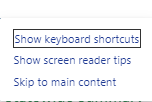
- Show keyboard shortcuts
- Show screen reader tips
- Skip to main content
- To reach the dashboard content, navigate to the third menu item, "Skip to main content", with TAB key (arrow keys don't work), and press ENTER.
See the rest of the navigation and interaction below.
The basic concept for navigating the Power BI dashboard
A dashboard consists of multiple components of text boxes, filters, and data visualization graphics.
You may enter a component before reaching its content. To move on to another component, you first need to exit the component you’re in.
Frequently used Power BI keyboard commands
This is a list of keyboard commands that we tested with common tasks to browse, navigate and interact with Power BI dashboards.
Our testing was done with JAWS 2022 2207 and NVDA 2022.2.3 in Windows 11, VoiceOver in macOS Monterey, and keyboard with both operating systems.
The Microsoft Power BI documentation has the full list of keyboard commands.
Common tasks to navigate in a dashboard content area
For sighted users, the black or blue outline on an element indicates they are currently on.
| Task | Keyboard command | Note |
|---|---|---|
| Navigate to next element | TAB | Some screen readers can navigate elements with arrow keys, but this might cause failure to follow the intended reading order defined by authors. |
| Navigate to the previous element | SHIFT + TAB | |
| Enter a component | CTRL (CMD for Mac) + RIGHT ARROW |
Once you’re in a component, the next step varies by the type of component you’re in. |
| Exit a component, not text box | ESC | You stay in a component until you exit. As you are tabbing, focus circles elements within the component you’re in. |
| Exit a text box component | TAB | |
| Jump from the last component to the first one | TAB |
Component specific tasks
You stay in a component until you exit. As you are tabbing, focus circles elements within the component you’re in. To exit a component, use ESC key.
Slicer
Slicer is a filter component you can use to refine the data.
| Sub component | Task | Keyboard command | Note |
|---|---|---|---|
| Menu (combo/list box) | Open menu | SPACEBAR or ENTER | |
| Menu (combo/list box) | Browse menu options |
DOWN ARROW to forward UP ARROW to backward |
VoiceOver needs VO key with the ARROW keys. You cannot go to the last item from the first one with UP ARROW or to the first one from the last one with DOWN ARROW. You cannot navigate with LEFT and RIGHT ARROW keys. |
| Menu (combo/list box) | Go to the first (top) menu option | HOME | |
| Menu (combo/list box) | Go to the last (bottom) menu option | END | |
| Menu (combo/list box) | Select a single option | SPACE | |
| Menu (combo/list box) | Select multiple contiguous options |
SHIFT + DOWN ARROW to select next the item SHIFT + UP ARROW to select the previous item |
It doesn't let you select the item you're on. |
| Menu (combo/list box) | Select multiple noncontiguous options |
|
|
| Menu (combo/list box) | Exit the option area | ESC | |
| Date range | Access the date picker from the date field |
ENTER on the date field |
The date picker is not functional with VoiceOver. Please type in a date. |
| Date range | Select a year |
|
|
| Date range | Select a month |
When the currently selected year is what you want,
After selecting a year,
|
When you don't change the year, in Step 2, pressing TAB multiple times doesn't take you to the month options. |
| Date range | Enter the calendar |
TAB |
|
| Date range | Navigate the calenda |
ARROW keys UP/DOWN ARROW to jump to the closest Sunday |
RIGHT ARROW on the last day of the month takes you to the first day of the next month. LEFT ARROW on the first day of a month takes you to the last day of the previous month. |
| Date range | Select a date | SPACEBAR or ENTER |
The date picker is not functional with VoiceOver. The date picker closes and the date field is updated with the date you selected. The date field has a focus. |
| Date slider | Change date |
RIGHT/DOWN ARROW to one day forward LEFT/UP ARROW to one day backward |
The date slider is not functional with VoiceOver. This is an alternative way to change the date to the date picker. |
| Checkbox group | Navigate checkboxes |
DOWN ARROW to forward TOP ARROW to backward |
RIGHT/LEFT ARROWS don't work. |
| Checkbox group | Select checkbox | SPACEBAR or ENTER |
Data tables
| Task | Keyboard command |
|---|---|
| Enter the data table | ENTER |
| Navigate the data table | ARROW keys |
| Exit the data table | ESC |
Data visualization graphics
For a bar chart, line chart, matrix, and so on, you might have options to browse as a data visualization graphic or data table when you approach them if they are configured to enable the options.
| Sub component | Task | Keyboard command | Note |
|---|---|---|---|
| Data visualization graphic | Enter the data visualization graphic | ENTER | |
| Data visualization graphic | Navigate the groups of the data visualization components (axes, data points, legends) |
TAB, RIGHT, or DOWN ARROWS to forward SHIFT + TAB, LEFT or UP ARROWS to backward |
|
| Data visualization graphic | Enter the group component | ENTER | |
| Data visualization graphic | Navigate elements in the group component |
RIGHT ARROW to forward LEFT ARROW to backward |
UP/DOWN ARROWS don't work |
| Data visualization graphic | Select/unselect the element to filter data | SPACEBAR or ENTER | |
| Data visualization graphic | Exit the group component | ESC | |
| Data table as an alternative to data visualization graphics | Display the data table | ALT + SHIFT + F11 | As of Sept. 2, 2022, the data tables are accessible to screen readers, but not to keyboard users. With a keyboard, unable to reach table elements. |
| Data table as an alternative to data visualization graphics | Navigate the data table | ARROW keys |
For screen reader users only. You might need to use your screen reader's keyboard commands to navigate the table elements. |
| Data table as an alternative to data visualization graphics | Leave the data table | ESC | It takes you back to the data visualization. |
Card
Card contains text content as a graphic.
| Task | Keyboard command | Note |
|---|---|---|
| Enter the card | ENTER |
For screen reader users, as you enter the card its content gets announced. If you don't hear "graphic" after the content, it might have nested cards. You need to enter the child card to access its content. When you hear "graphic", you know you've reached the end of the card. |
| Exit the card | ESC | Even you're in a child card, ESC gets you out of the parent card. |
Text box
| Task | Keyboard command | Note |
|---|---|---|
| Enter the text box | ENTER | |
| Exit the text box | TAB |
No need ESC to exit the text box. Once the content is announced, move on to the next element with TAB. |
Navigating between pages
A dashboard could consist of multiple pages. Its pagination links locate below the dashboard content area.
Screen reader users will find that navigating around the pagination links is confusing because of the lack of information on the label of the component, the current page, and the total page number. Currently, no configuration options are available to make the information available.
VoiceOver behaves differently from other screen readers. See the instructions for VoiceOver.
| Task | Keyboard command | Note |
|---|---|---|
|
Leave the dashboard content area |
|
You press the first ESC when you're out of any component. The first ESC to leave the area where you're in the dashboard content area. The second ESC to leave the dashboard content area |
| Go to the pagination links |
|
No label for the pagination links for screen reader users. Screen readers don't always announce the linked text "Microsoft Power BI." As the link gets focused, they could announce nothing. When you hear "previous page", you're in the pagination links. NVDA says, “Clickable previous page.” JAWS and VoiceOver say, “previous page.” They don’t indicate the element is clickable, but it's still clickable. |
| Navigate between the previous and next page links |
TAB from the previous page link to the next page link. SHIFT + TAB from the next page link to the previous page link. |
|
| Go to another page |
SPACEBAR or ENTER on the previous/next button Press the key multiple times to go over the immediate next/previous page. |
Pressing the key to trigger to render another page. You might need to repeat this depending on which page you're going to. Screen readers don’t announce the completion of the rendering. With a moderate Internet connection, it completes in under 10 seconds. Screen readers don’t announce which page is currently open. |
Instructions for VoiceOver users
ESC to leave the dashboard content area doesn't work. Use LEFT and RIGHT ARROW keys with VO keys to navigate between the dashboard content area container and the elements outside the dashboard content area.
There is no clear indication when you leave the dashboard content area. When you hear "zoom underscore space", you are out of the dashboard content area.
Go back to the dashboard content area from the pagination links
Power BI doesn’t have quick access to the top of the dashboard content area from the pagination link area.
In VoiceOver, SHIFT + TAB to navigate to the dashboard content area doesn't work. Use LEFT ARROW with VO keys.
| Task | Keyboard command | Note |
|---|---|---|
|
Leave the pagination link area |
SHIFT + TAB Use the key command:
|
Reverse the steps to get to the pagination links, from the next page link to the previous page link, the linked text "Microsoft Power BI", then leave the section below the dashboard content area. |
| Leave the section where the pagination links locate |
SHIFT + TAB |
ESC doesn't work to leave the section. |
| Enter the dashboard content area | CTR(CMD for Mac) + ENTER | You reached Step 2 of Access a dashboard from the page. |
Back to the main page, leave the dashboard
The Microsoft Power BI documentation doesn't mention any keyboard command to leave an embedded dashboard. We found the following two methods through our testing, one for keyboard users and one for screen reader users.
For keyboard users
This takes you to the first focusable element after the dashboard on the main page.
- Navigate to the section below the dashboard content area
- In the section, navigate to the third last interactive element
There are some variations with the bottom section content depending on its configuration. This results that the third last element could vary depending on the presented content specifically configured for the dashboard or your browser's security setting.
 Here are the third last elements in the section in most cases:
- LinkedIn link (the most common)
- Next page link
- Microsoft Power BI link
- When you reach the element, press TAB key 3 times consecutively. Don't put a pause between each press action.
- You've jumped to the first focusable element after the dashboard on the main page.
This works only on the last third element. On other elements, it just skips a couple of elements in the section.
For screen reader users
There are some differences between screen readers as noted below. The behaviors of screen readers not mentioned below might match one of them.
NVDA
- Navigate to the section below the dashboard content area
- Navigate to the last element in the section, the open in full screen mode button
- Press DOWN ARROW key repeatedly unit you hear "out of frame"
JAWS
- Navigate to the section below the dashboard content area
- Navigate to the last element in the section, the open in full screen mode button
- Press DOWN ARROW key 3 times. You land on the first element after the iframe on the main page
VoiceOver
- Make sure you're on one of the following levels:
- The dashboard content area outside a component
- Application
- Power BI report group
- the Zoom buttons
- the Fit to page button
- If you're in the bottom section where the Microsoft Power BI link, the pagination links, the social media share links, and the open in full-screen mode button locate, use SHIFT + TAB to navigate to the Fit to page button. The method doesn't work in the bottom section.
- Press ESC twice
- Press SHIFT + TAB
- You hear "leaving Power BI." You are at the element right before the Power BI dashboard on the main page. You are out of the iframe.
- Pass through the iframe to browse content after the dashboard.
Resize a dashboard
Browsers have a built-in zoom feature (CTRL + + or -). When you use the feature, a dashboard gets resized along with the other page content. The dashboard might get refreshed to be displayed in proper proportion in the process.
Power BI dashboards have their zoom menu located below the dashboard content.
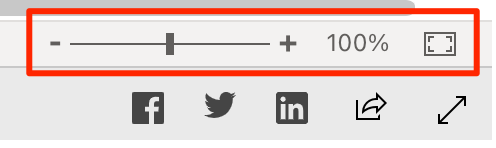
If you need to enlarge a dashboard more than you can on the page, use Power BI's full screen mode to display the dashboard itself, then adjust the size you need. The full screen mode button is at the right bottom below the dashboard content.
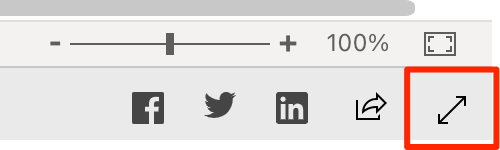
Use ESC to leave the full screen display.
Alternative presentations to dashboards
Data tables as alternative presentation formats are presented as download links, usually locate below dashboards. They could be grouped in the resources section.
Accessibility improvement efforts
We're aware that Power BI dashboards are not fully accessible at this time and continually making efforts to ease the inconvenience to affected users.
Known issues are monitored for solutions and workarounds for users. Power BI releases are reviewed for any accessibility improvements.
This page will be updated with any helpful information for affected users that comes available.