Author: Tony Rassias - Deputy Director of Accounts
Our April 6th, 2023 City & Town article entitled “Free Cash Update” provided early indications of July 1, 2022 free cash certifications showing more increases than decreases and the continued growth of free cash as a percentage of the operating budget. The following piece expands our scope to include what we saw when certifications were completed for this certification period as well as a preliminary overview of certified free cash as of July 1, 2023. For an informational overview of free cash, please see our “Introduction the Free Cash” video.
As of July 1, 2022 Certifications (approved during FY2023)
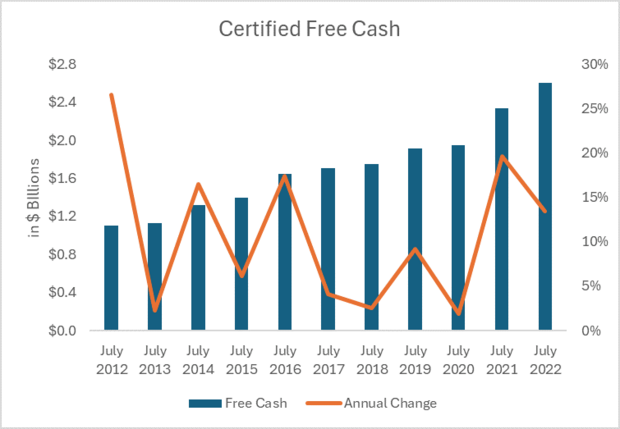
Free cash certifications totaled $2.65 billion, increasing $313.7 million (13.4%) over the previous year.
Municipal accounting officials reported to the Bureau of Accounts (BOA) that $821.1 million of free cash came from FY2022 estimated receipts above budget, $647.2 million from budgeted but unspent FY2022 appropriations and $1.1 billion from unobligated free cash of the prior year (i.e. certified free cash as of July 1, 2021).
In this certification period, 348 communities were certified with positive free cash, one negative and two had no submission. The greatest free cash increase was in Boston at $74.7 million and the greatest decrease in Cambridge at $15.2 million. For communities that had free cash certified for both fiscal years, we saw a median increase of $704,970 and median decrease of $487,445.
Certifications for Boston and Cambridge of $440.7 million and $199.3 million respectively had a considerable effect on the total statewide July 1, 2022 certification. Their total represented about 24% of the state total and if their certifications are removed from the last two fiscal periods, the statewide total increase for the remaining certified communities in both years reveals a net 14.2% increase rather than a net 13.4% total increase as noted above.
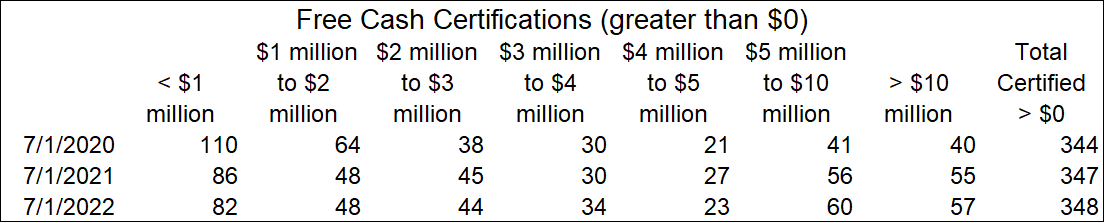
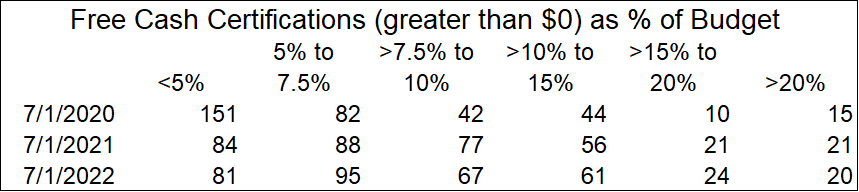
The following table categorizes free cash certifications.
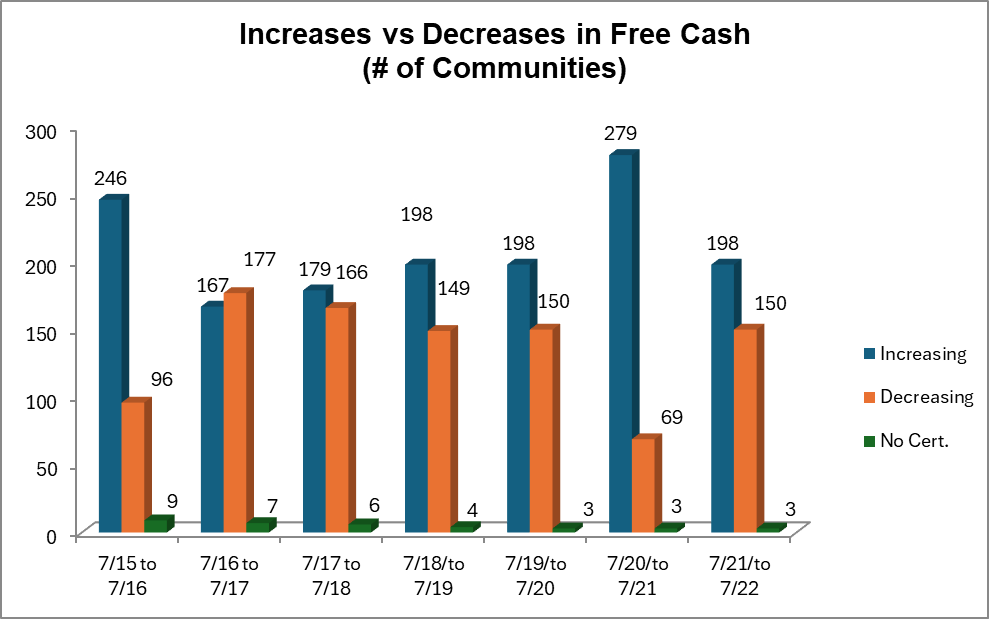
Despite the rise in the statewide total, not every community experienced an increase from the previous period as shown in the graph below. Note that in only one fiscal period shown did the number of decreases exceed increases.
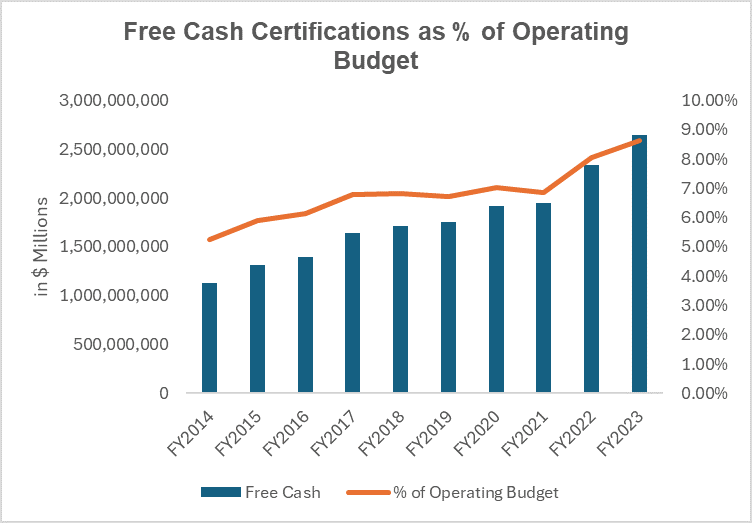
It is helpful to measure free cash as a percentage of the general fund operating budget. As shown in the following graph, statewide free cash as a percentage of budget has increased to 8.6% from 5.3% in FY2014.
The following table categorizes free cash certifications where the increases occurred. It shows a significant decrease in the number below 5% of budget, which is an indicator of increased balance sheet strength.
Appropriations
BOA does not receive information regarding purpose of each appropriation. However, we can determine whether the appropriation was made in total for a particular purpose, to reduce the tax rate, or a combination of both.
Included in the 348 communities with positive free cash during the July 1, 2022 certification period were three that appropriated $0 from their certification, 57 that appropriated their entire certification and eight that left unappropriated an amount under $100. The following table shows the range of free cash appropriated and the number of communities in that range.
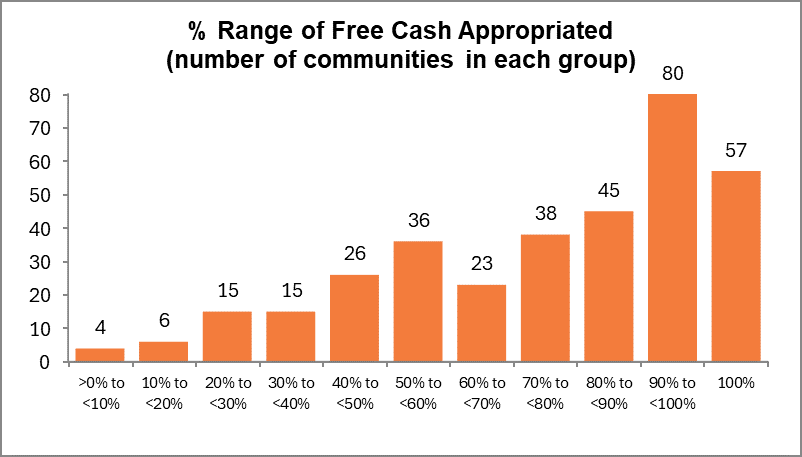
For the 345 communities that appropriated free cash, 288 voted for particular purposes only, while 57 voted a combination of particular purposes and to reduce the FY2023 and/or FY2024 tax rate. None voted to reduce the FY2023 tax rate only and six voted to reduce the FY2024 tax rate only. The total amount appropriated was $1.5 billion or 56% of the total statewide July 1, 2022 certification.
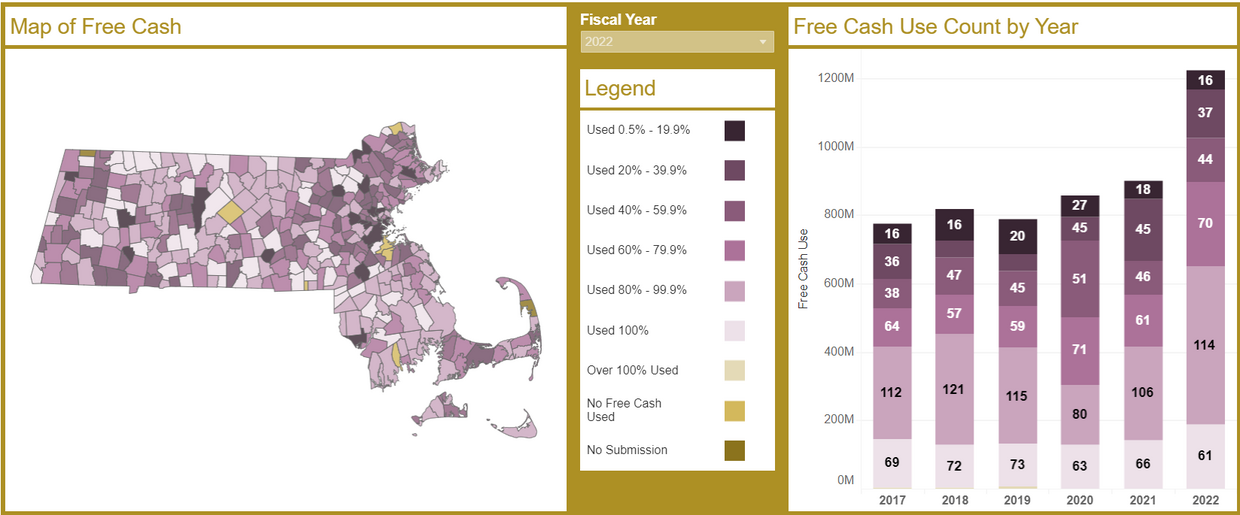
The previous graph represented the amount of free cash appropriated from the July 1, 2022 certification which encompassed both FY2023 and FY2024. The following image represents a sample of the color-coded visualizations available on our website of the amount of free cash being appropriated against each fiscal year’s budget.
Preliminary Indications for July 1, 2023 Certifications (approved in FY2024)
At the time of this writing, 335 cities and towns have free cash certified as of July 1, 2023 with 181 showing increases and 154 showing decreases from their prior certification. The statewide total increase for these 335 is $106.4 million or 4.1% over their previous certification supported in large part by Boston’s $73.8 million or 16.7% increase. Without Boston’s certification in the calculation, the increase thus far is $32.6 million or 1.5%. Data for the same 335 communities indicates that free cash as a percent of budget continues to be strong at about 8.5% of FY2023 general fund operating budgets statewide.
The data reveals that four communities (Springfield, Chicopee, Swansea, Brockton) had a decrease in July 1, 2023 certified free cash of greater than $10 million from their previous July certification and three (Boston, Lee, Fall River) had an increase of greater than $10 million. This and more data can be found in the DLS Municipal Finance Trend Dashboard, Operating Position report. Final results will be reported in our next update.
To review color-coded maps of free cash and other statewide statistics, visit our Municipal Finance Visualizations. Utilize the Municipal Financial Self-Assessment and the Municipal Finance Trend Dashboard tools for community-specific data trended over a multi-year period.
Helpful Resources
City & Town is brought to you by:
Editor: Dan Bertrand
Editorial Board: Marcia Bohinc, Linda Bradley, Sean Cronin, Emily Izzo and Tony Rassias
| Date published: | May 16, 2024 |
|---|