About the Data
This dataset includes the percentage of Massachusetts adults with some chronic disease or risk behavior. These percentages are created by combining three years of Massachusetts Behavioral Risk Factor Surveillance System (BRFSS) data and U.S. Census data. BRFSS is an annual survey that asks Massachusetts residents about their health and related behaviors.
Percentages are available by counties, towns, and statewide. Statewide BRFSS data are provided as references for the three years that were combined to create these percentages. For additional single-year BRFSS data, go to the statewide BRFSS dataset.
The percentages estimate the proportion of adult ages 18 and older with some chronic disease or risk behavior. Risk behaviors are activities, such as diet and exercise, that increase a person's chance of suffering from an illness or injury.

As you look at data on this webpage, you may see differences among population groups. The differences are especially noticeable between white people and people of color.
These differences exist because of structural racism. These differences are NOT because of an individual’s choices, behaviors, or identity.
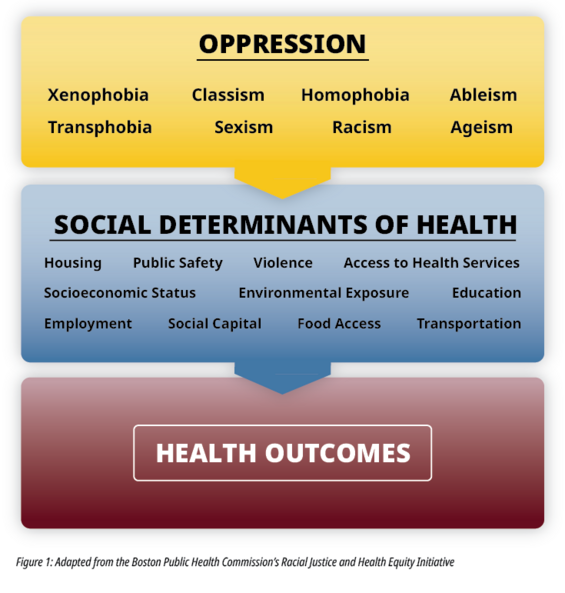
Systems of oppression, such as racism, cause harm to everyone. They also influence the social determinants of health (SDoH), which impact health outcomes. See Figure 1.
It is important to keep these notes in mind when looking at the data and using it to inform public health efforts.
If you decide to share these data, remember to use racial equity context and framing. The DPH Racial Equity Data Road Map is one resource that can help.
About Chronic Diseases and Risk Behavior (BRFSS Small Area Estimates) Data
Methods
Only BRFSS data from 2011 and later are included and should never be combined or compared with older BRFSS data. Some BRFSS questions are asked every other year so there may only be one estimate during a 5 year time period (ex: 2011, 2013, 2015) instead of 3.
Warning
Due to the decline in BRFSS participation, these percentages cannot be calculated again with more recent BRFSS data, and users should not expect them to be updated. The timeframe of these data (2012-2014) should be taken into account when these percentages are used or reported.
These percentages must follow specific public reporting rules in order to be considered valid estimates. They must meet at least one of two conditions:
1) The precision (1/2 width of 95% CI) for the Small Area Estimate (SAE) should be no greater than 2.5% for direct state prevalence estimate < 10% (or 91% to 100%); 3.0% for direct state prevalence estimate 11% to < 20% (or, 80% to < 90%); 3.5% for direct state prevalence estimate 21% to < 30% (or, 71% to < 80%); 4.0% for direct state prevalence estimate 30% to < 70%, and 2) The town-level sample size must be 25 or greater.
If none of the conditions above are met, the estimate is hidden. If only one of the above conditions is met, the percentage should include this warning (caveat) language:
"In order to provide data for more Massachusetts communities, we include town level estimates that may be based on relatively few respondents or have standard errors that are larger than average. The confidence interval for this community is wider than the normal limits set by the Massachusetts Department of Public Health. Therefore, the estimate for this town should be interpreted with caution."
These percentages are created by combining three years of data and therefore cannot show change over a short period of time. Use should be limited to program planning or community needs assessment. Do not use this data to evaluate health changes as a result of programs or interventions.