Author: James J. Paquette – Bureau of Local Assessment ProgramCoordinator
In a recent edition of City & Town, we introduced the basics of Equalized Valuations (EQV). In this edition, we’ll examine data trends and provide helpful context related to EQV. For reference, EQV data is available on the DLS website.
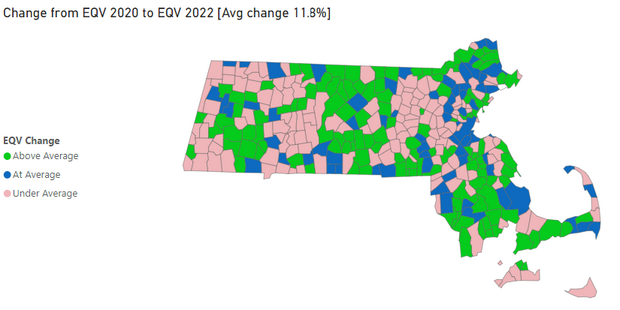
Value Changes in EQV from 2020 to 2022
Before we begin, it’s important to note that EQV does not include property exempted from local taxation. In 2020 EQV totaled $1.42 Trillion statewide and increased to $1.58 Trillion in 2022 statewide which was an overall increase of 11.5%. In 2022 the average change per community was 11.8% for all 351 cities and towns in the Commonwealth. The three municipalities with the highest change from the prior 2020 EQV are Everett, Egremont and Blanford with changes of 35.2%, 33.6%, and 33.4%, respectively. The three communities with the lowest change from the prior 2020 EQV are Goshen, Dover and Mount Washington with changes of 1.5%, 0.8%, and 1.65%.
When sorted by the 14 counties in Massachusetts, eight saw a total average below the community average and six saw a total above the community average. The largest change occurred in Suffolk County with 16.1%, while the smallest was in Nantucket with 2.5%. View EQV data in more detail.
Reviewing EQV from 1994-2022
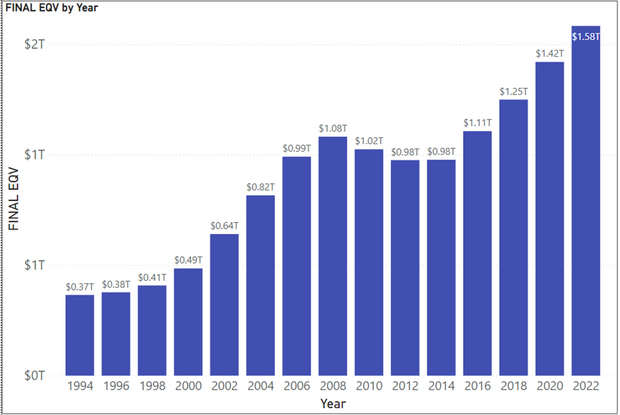
When reviewing the previous 15 EQVs, it becomes apparent that changes in values have had their ups and downs. Despite these fluctuations, there has been a 433% increase over 28 years. All four classes of property have seen major increases from the 1994 EQV to the 2022 EQV, with Residential showing the greatest increase and Industrial showing the smallest.
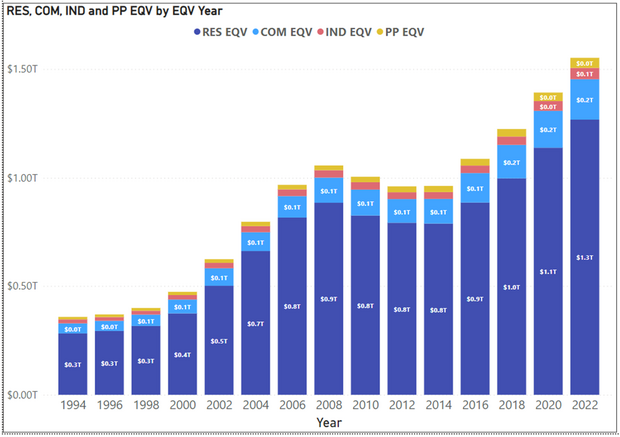
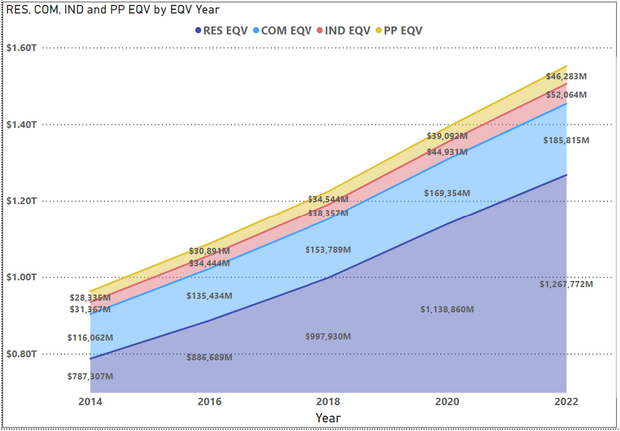
A Closer Look at 2014-2022
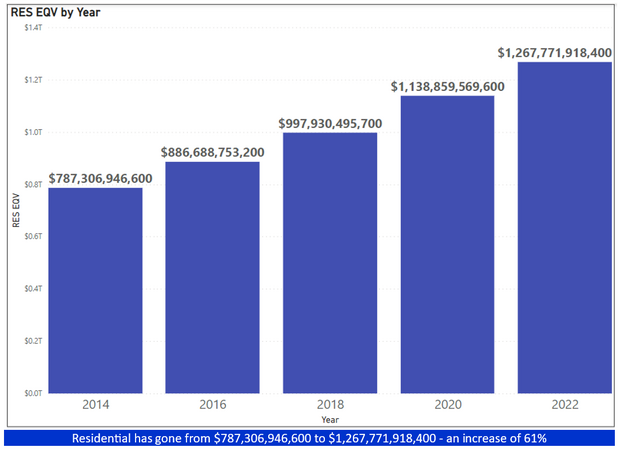
There has been a continuing increase in EQVs for all four property classes over the last four EQVs. Residential continues to represent the most significant change, increasing from $787B in 2014 to $1.3T in 2022.
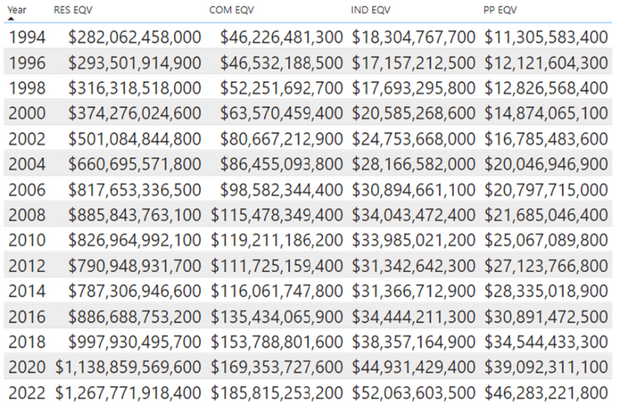
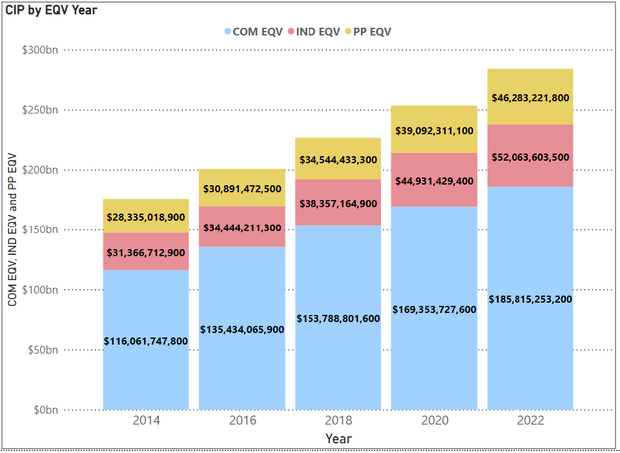
Reviewing Commercial, Industrial and Personal Property EQV
Property is broken into four separate and distinct classifications. They are residential, commercial, industrial, and personal property. Here's more information on property classification and taxation. When reviewing EQV broken down by classification, it’s important to acknowledge changes beyond those in the residential class. Commercial EQV has increased 60% from $116B to $186B. Industrial has increased 66% from $31B to $52B. Personal property has increased 63% from $28B to $46B.
We hope you’ve found this information interesting and useful. View EQV data in more detail. If you have any questions regarding your community’s EQV or would like to suggest a topic for future articles, please email us at bladata@dor.state.ma.us.
Helpful Resources
City & Town is brought to you by:
Editor: Dan Bertrand
Editorial Board: Tracy Callahan, Sean Cronin, Janie Dretler, Jessica Ferry, Christopher Ketchen, Paula King, Jen McAllister and Tony Rassias
| Date published: | November 16, 2023 |
|---|