Data at a Glance
Fatal injuries at work are all the more tragic because they are largely preventable. Information about where and how they occur is essential to develop effective prevention programs. This update provides an overview of fatal injuries at work that occurred in Massachusetts during 2016-2017 and includes details collected by both the Fatality Assessment and Control Evaluation (FACE) and the Census of Fatal Occupational Injuries (CFOI) projects. Included are deaths traditionally linked to the work environment such as falls, electrocutions, and exposure to toxic chemicals. Also included are workplace opioids overdoses, homicides and suicides and motor vehicle-related fatalities that occurred during travel on the job. Deaths from occupational illnesses and heart attacks at work are excluded.
How many MA workers died from injuries between 2016 and 20171?
- 220
What were the leading causes?
- Workplace overdose
- Fall to a lower level
- Roadway crash
- Workplace suicide
- Worker being struck by a vehicle
Who was at highest risk? (ordered by rate of injury)
- Fishermen and agricultural workers
- Construction workers
- Transportation and material moving occupations
- Installation, maintenance, and repair workers
| County of Injury, 2016-20172 | # of Injuries | County of Injury, 2016-20172 | # of Injuries |
|---|---|---|---|
| Middlesex | 47 | Hampden | 12 |
| Suffolk | 31 | Barnstable | 9 |
| Essex | 28 | Berkshire | 6 |
| Bristol | 23 | Nantucket | 3 |
| Norfolk | 21 | Hampshire | 2 |
| Worcester | 21 | Franklin | 1 |
| Plymouth | 14 |
Report Highlights
Unintentional overdose at the workplace was the leading single cause of fatal injury at work in 2016-2017, resulting in 54 deaths. These deaths occurred across most industry sectors, with the leading sectors being Accommodation and Food Service (9) and Construction and Real Estate and Leasing (six deaths each). The average age of workplace overdose victims was 39.
Massachusetts is experiencing an epidemic of opioid-related overdoses and deaths. The number of opioid-related overdose deaths in the state tripled between 2011 and 2016.3 A portion of these deaths occur at workplaces and are included in this report. With assistance from the Massachusetts Department of Public Health Injury Surveillance Program that runs the State Unintentional Drug Overdose Reporting System (SUDORS) in Massachusetts, we were able to identify 25 and 29 workplace overdoses in 2016 and 2017, respectively.4 Eighty-five percent of these deaths involved fentanyl, the highly potent synthetic opioid that in recent years has contributed to the increase in accidental overdose.
In addition to the increase in opioid-related overdose deaths in the workplace in 2016-2017, there also continued to be an increase in work-related motor vehicle-related fatalities in Massachusetts. Both the number of roadway crashes and the number of pedestrian deaths were higher than in the prior two-year period. Of those vehicle occupants who were killed in crashes, only one in four was using a seat belt. Resources on motor vehicle safety for workers can be found at Center for Motor Vehicle Safety.
Falls in construction continue to be a priority for prevention in Massachusetts and nationwide. The national Campaign to Prevent Falls in Construction is now in its sixth year. New safety handouts, videos, and materials for toolbox talks are available from this site.
It is important when reporting statistics about fatal occupational injuries to acknowledge the individuals that these numbers represent. Continued efforts are needed to reduce the human as well as economic toll of preventable deaths at work in the Commonwealth. The surveillance findings presented here are intended to guide government, industry, labor, and community organizations in developing and implementing strategies to prevent similar tragedies in the future.
Special Study: Opioid-related Overdose Deaths
In 2018 the Occupational Health Surveillance Program (OHSP) conducted a special study to learn more about how work may be a factor in overdoses. We looked at all overdoses of Massachusetts residents that occurred from 2011 to 2015 and used death certificate data to examine the industry and occupation of the victims.5 This analysis revealed some important findings:
- Construction and extraction workers had both a high rate and a high number of opioid-related overdose deaths.
- Among males, workers in farming, fishing, and forestry occupations; construction and extraction occupations; and material moving occupations had rates significantly higher than the average rate for Massachusetts male workers.
- Among females, workers in healthcare support occupations and food preparation and serving related occupations had rates significantly higher than the average rate for Massachusetts female workers.
- The rate of fatal opioid-related overdose was higher among workers employed in industries and occupations known to have high rates of work-related injuries and illnesses.
- The rate of fatal overdose was also higher in occupations with lower availability of paid sick leave and lower job security.
These findings underscore the need for educational and policy interventions targeting worker populations to prevent opioid-related overdose deaths. Interventions should address workplace hazards that cause injuries for which opioids are prescribed, as well as appropriate pain management following injury, including safer opioid prescribing, access to evidence-based treatment for opioid use disorders, and overdose prevention education.
In Massachusetts, workplace health and safety stakeholders are working with substance addiction service providers and policy makers to provide opioid awareness peer training for high risk worker groups and to identify additional opportunities to implement worker-oriented opioid overdose prevention strategies.
Overview of Fatal Injuries at Work, 2016-2017
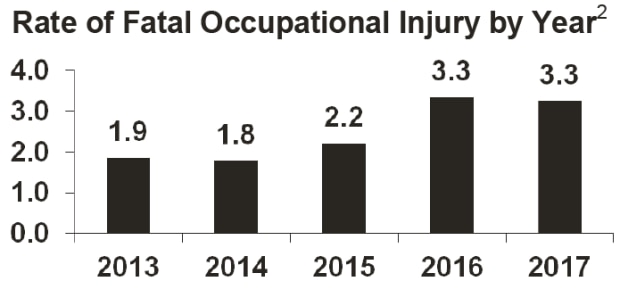
- In Massachusetts, 220 individuals were fatally injured at work during this period: 111 in 2016 and 109 in 2017. This included 199 men and 21 women. The fatal occupational injury rate for the period was 3.3 deaths per 100,000 full-time workers. This rate is higher than recent years.2,6 This is due to an increase in workplace overdose deaths and also an increase in motor vehicle deaths.
- The workers ranged in age from 8 to 79 years, with an average age of 46 and a median age of 47. The fatalities resulted in a total of 6,320 potential life years lost, an average of 29 potential life years lost per victim.2 Potential life lost is the difference between the worker’s age and 75 years. The youngest victim was a youth who was trampled while exercising cattle. The oldest victim was a boiler operator who was injured in a fall down industrial stairs.
- A total of 172 (78%) of the workers were White non-Hispanic; 24 were Hispanic; 13 were Black or African-American non-Hispanic; five were Asian non-Hispanic; and six were other races. The fatality rate (deaths per 100,000 full-time workers) for each of these demographic groups was:
- Hispanic: 3.8
- White non-Hispanic: 3.4
- Black non-Hispanic: 2.9
- Asian non-Hispanic: 1.12,6
- Hispanic workers disproportionately work in more dangerous jobs and suffer more workplace injuries and deaths.7 Factors contributing to the increased risk of work-related injury and illness include: lack of training or supervision; language, literacy and cultural barriers in the workplace; fear of discrimination; and economic pressures that deter workers from speaking up about workplace hazards. In high risk industries such as construction, Hispanic workers are more likely to be placed in positions where the hazards are less likely to be controlled.
- Thirty-seven workers (17%) were born outside of the U.S. Foreign-born victims worked in a range of industries: the leading sectors were construction (13), restaurants (5), and retail trade (5). Countries of birth with the largest number of workers fatally injured in Massachusetts were Guatemala (7), Brazil (6), and Ecuador (4). The rate of fatal injury among foreign-born workers was 2.6 per 100,000 workers and the rate among U.S.-born workers was 3.5 per 100,000 workers.2 The fatality rate in foreign-born workers had dropped in 2014-2015 and then went up during this period. This is possibly due to an increase in the immigrant workforce and then the increase in overdoses.
- Thirty-six workers were self-employed.8 The fatal injury rate among self-employed workers was 11.0 per 100,000 workers, nearly four times the rate of 2.9 among wage/salary earners.2,6
- The largest number of fatal injuries occurred in Middlesex County (47), followed by Suffolk (31), Essex (28), Bristol (23), and Norfolk and Worcester (21 each).2
- Nationwide, 10,337 workers died as a result of fatal occupational injuries in 2016-2017. The national fatal occupational injury rate was essentially unchanged at 3.6 in 2016 and 3.5 in 2017.9 The difference in fatality rates between the U.S. and Massachusetts is due partly to the fact that proportionately fewer workers in Massachusetts were employed in high-risk industries such as mining or heavy manufacturing. Massachusetts had lower rates of fatal highway transportation incidents and workplace homicide and higher rates of workplace overdose during this period.
FACE Report 16MA001: Laborer Fatally Injured After Falling from a Home Under Construction
A 22-year-old male laborer employed by a residential contractor was fatally injured while working on a single family house under construction. The worker was on the top plate of a studded exterior second story wall when he lost his balance and fell approximately 24 feet to the ground. The company did not have a safety and health program and did not provide employees with safety and health training.
To prevent similar incidents, Massachusetts FACE recommended that employers should:
- Provide fall protection for all employees exposed to fall hazards of six feet or more;
- Provide all employees with training on fall protection and other equipment such as ladders and scaffolding that will be used to complete tasks; and
- Develop, implement, and enforce a safety and health program that addresses hazard recognition and avoidance of unsafe conditions.
FACE report: Laborer Fatally Injured After Falling from a Home Under Construction - Massachusetts
Types of Events Causing Worker Deaths
| Event/Exposure | Number of Fatalities | Percent |
|---|---|---|
| Transportation incident | 68 | 31% |
| 33 | 15% |
| 20 | 9% |
| 8 | 4% |
| 3 | 1% |
| Exposure to harmful substance or environment | 60 | 27% |
| 54 | 25% |
| 3 | 1% |
| Fall, slip, or trip | 40 | 18% |
| 34 | 15% |
| 6 | 3% |
| Violence and other injury by person or animal | 38 | 17% |
| 28 | 13% |
| 6 | 3% |
| 3 | 1% |
| Contact with object or equipment | 13 | 6% |
| 5 | 2% |
| 4 | 2% |
| Total | 220 | 100% |
Note: Event/exposure categories and sub-categories with < 3 fatalities are not shown. Sub-categories may not add up to the bolded category totals. Percentages may not add to 100% due to rounding.
Source: Occupational Health Surveillance Program, Massachusetts FACE and CFOI, 2016-2017.
- Unintentional overdose at work was the leading single cause of fatal injury at work in 2016-2107, resulting in 54 deaths. These deaths occurred across most industry sectors, with the leading sectors being Accommodation and Food Service (9) and Construction and Real Estate and Leasing (six deaths each). The average age of workplace overdose victims was 39.
- Falls to a lower level resulted in 34 deaths. Twenty-three (68%) of these were in the construction industry sector. Twenty-one of the falls to a lower level were from heights of 20 feet or less; the overall range was three to 55 feet.2 Twelve workers died in falls from ladders.
- Roadway motor vehicle collisions and rollovers contributed to the fatal injuries of 33 workers. Twenty additional deaths involved vehicles hitting pedestrians who were working in roadways, work zones, parking lots, or other work locations.
- Workplace suicide accounted for 28 deaths. Workplace suicide occurred in small and large companies and in a wide range of industries
Fatal Injuries at Work by Industry
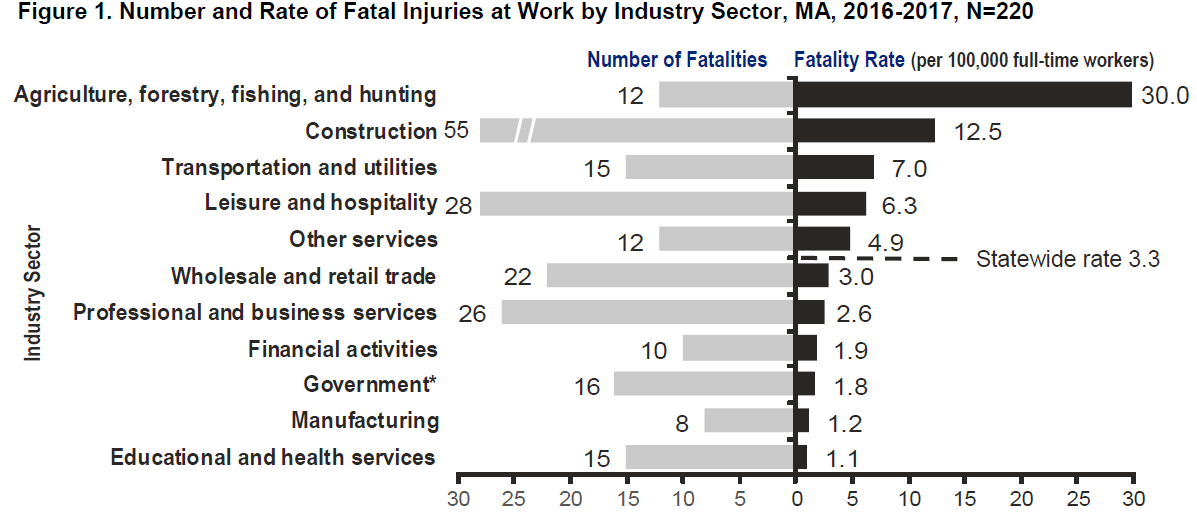
Note: Data not presented for industry divisions with fewer than five fatalities (N = 1 death).
*The Government category includes fatalities sustained by public sector workers regardless of industry.
Source: Occupational Health Surveillance Program, Massachusetts FACE and CFOI, 2016-2017.
- The Agriculture, Forestry, Fishing and Hunting industry sector had the highest occupational fatality rate in 2016-2017 (12 deaths; 30.0 per 100,000 full-time workers). Nine fishermen and three agricultural workers were fatally injured. This included five fishermen who worked in shellfish harvesting.2
- Construction continued to be a high risk industry, with the second highest fatality rate (12.5 per 100,000 workers) and the highest number of deaths (55 deaths).2 Twenty-three died from a fall to a lower level. Ten construction workers were killed in motor vehicle crashes while driving for work and five were struck by vehicles or equipment.
- The Transportation and Utilities sector had 15 deaths, for the third highest rate of 7.0 deaths per 100,000 full-time workers. Nine of these workers died in transportation incidents.
- Thirteen of the victims (46%) who worked in the Leisure and Hospitality sector worked in restaurants. Workplace overdose was the leading cause of death in this sector, accounting for 12 deaths.
- Of the 12 workers in the Other Services sector, seven (58%) were in automotive repair or services.
OSHA Enforcement and Penalties
The Occupational Safety and Health Administration (OSHA) investigated 55 (25%) of the fatal work-related injuries identified by the Massachusetts FACE and CFOI projects that occurred in 2016-2017.10 Of the remaining 165 fatal incidents, 49 involved workers who fall outside of OSHA jurisdiction such as public sector employees, sole proprietors or the self-employed, and commercial fishers. One-hundred-and-four additional deaths were events not routinely addressed by OSHA such as overdoses, suicides, homicides, roadway motor vehicle collisions, or plane crashes.
OSHA levied fines for violations of health and safety standards against 36 of the employers they investigated in response to these fatal incidents. The agency assessed a total of $2,815,034 in initial penalties for violations identified in these fatality investigations, with the lowest fine assessed at $2,772 and the highest at $1,475,813.
FACE Report 17MA018: Equipment Operator Dies After Zero-Turn Mower Overturns
A 57-year-old male equipment operator employed by a municipality was killed when operating a ride-on zero-turn mower. The worker was mowing grass alone and not using the mower’s rollover protective structures (ROPS). While turning left on a slope, the mower struck a low-lying rock covered by vegetation and the mower overturned. The municipality did not have a safety and health program, but did provide workers with some basic safety training.
To prevent similar incidents, Massachusetts FACE recommended that employers should:
- Ensure ride-on mower operators use ROPS and seatbelts when the mower is equipped;
- Routinely perform job safety analyses before mowing begins to ensure the proper equipment and practices are used to perform the task safely;
- Ensure that ride-on mowers are not operated on slopes where the angle is greater than the maximum slope specified by the manufacturer;
- Routinely provide employees with training on the equipment used to complete tasks;
- Develop and implement a comprehensive safety and health program that addresses hazard recognition and avoidance of unsafe conditions; and
- Consider developing policies that prevent employees from working alone when performing certain tasks.
Fact sheet: Rollover protective structures and seat belts keep employees safe when operating zero-turn mowers
About this Report
The OHSP in the Massachusetts Department of Public Health (DPH) collects information on all fatal occupational injuries as part of the national Census of Fatal Occupational Injuries (CFOI), conducted in cooperation with the U.S. Bureau of Labor Statistics (BLS). Death certificates, records from the Occupational Safety and Health Administration (OSHA), news stories, police reports and other data sources are used to identify these deaths. These source documents are primarily collected by the Fatality Assessment and Control Evaluation (FACE) project, which conducts in-depth investigations of select fatal occupational injuries with support from the National Institute for Occupational Safety and Health (NIOSH). The purpose of the FACE project is to develop a detailed understanding of how fatal injuries occur and to develop recommendations to prevent similar incidents in the future. These recommendations are disseminated to relevant industries, labor organizations, equipment manufacturers, and others in positions to take action to prevent work-related injuries.
Health and Safety Resources in Massachusetts
For detailed tables of fatal occupational injuries and previous fatality update reports as well as educational materials (FACE Facts and Safety Alerts), please contact the Massachusetts Department of Public Health, Occupational Health Surveillance Program, 250 Washington Street, 4th Floor, Boston, MA 02108-4619. Reports are available online or by calling 1-800-338-5223.
Please report work-related fatalities immediately to the DPH Toll-Free Occupational Fatality Hotline 1-800-338-5223 or by confidential fax (617) 624-5696.
Massachusetts Department of Labor Standards – Offers free consultation services to help private sector employers improve their safety and health programs and train employees.
Massachusetts Department of Industrial Accidents – Has grants available for providing workplace health and safety training to employers and/or employees in companies covered by the Massachusetts Workers’ Compensation Insurance Law.
Acknowledgements
The Occupational Health Surveillance Program would like to thank all agencies and people that contribute to our efforts to prevent work-related deaths by reporting fatalities and providing information during our fatality investigations. This project is a joint effort of several state and federal agencies. For their assistance in providing data and advice, we thank: OSHA Region I and area office staff; staff of the Registry of Vital Records and Statistics; local and state police departments; and clerks of cities and towns. We also appreciate the contributions of the Department of Labor Standards and the Department of Industrial Accidents in the Executive Office of Labor and Workforce Development; the Office of the Chief Medical Examiner; the U.S. Coast Guard; the National Transportation Safety Board (NTSB); the Boston Regional Office of the U.S. Bureau of Labor Statistics; and the National Institute for Occupational Safety and Health (NIOSH).
Download
Download this report in PDF format to print or share:
Massachusetts Fatality Update, 2016-2017
| Date published: | August 21, 2019 |
|---|