Approved applications information
In FY23:
- 143,356 applications were approved.
- That represents a 27.39% increase in approved applications over FY22, when the Department approved 112,531 applications. Additionally, the approval percentage for applications in FY23 increased by 3.16%, to 83.72%.
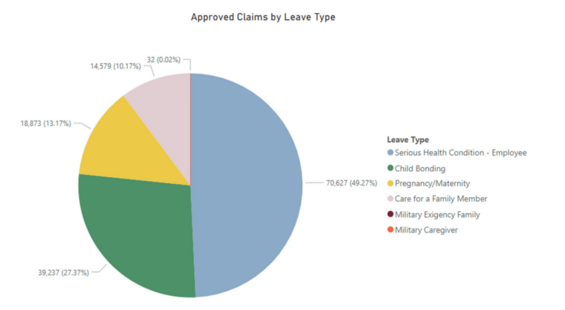
- Medical leave accounted for 62.55% of approved applications (89,500 approved applications).
- Medical Leave due to one’s own serious health condition accounted for 49.36% of approved applications (70,627 approved applications).
- Leave associated with standard recovery from childbirth or pregnancy are categorized as Medical Leave claims. Those leaves accounted for 13.19% of approved applications (18,873 approved applications). In FY23, 62.88% of covered individuals with an approved medical leave claim to recover from childbirth or due to pregnancy also had an approved child bonding family leave claim.
- Family leave to bond with a child following birth, adoption or foster care placement accounted for 27.37% of approved applications (39,237 approved applications).
- Family leave to care for a family member with a serious health condition accounted for 10.17% ofapproved applications (14,579 approved applications).
- Military exigency leave accounted for .02% of approved applications (32 approved applications).
- Leave to care for a family member who is a covered service member accounted for .01% of approved applications (8 approved applications).
| Leave Type | Approved Claimants | Percentage |
|---|---|---|
| Serious Health Condition - Employee | 70,627 | 49.27% |
| Child Bonding | 39,237 | 27.37% |
| Pregnancy/Maternity | 18,873 | 13.17% |
| Care for a Family Member | 14,579 | 10.17% |
| Military Exigency Family | 32 | 0.02% |
| Military Caregiver | 8 | 0.01% |
Denied applications information
As of June 30, 2023:
- 27,863 applications were denied, which was 16.27% of all filed applications that received a decision from PFML.
- That represented a 17.16% reduction in the percentage of filed applications being denied from FY22, when 19.64% of all filed applications were denied.
Reasons for denials
The following categories accounted for the denials issued by DFML in FY23:
| Type | Reason | Number of Applications |
|---|---|---|
| Eligibility | The applicant’s employer was either covered by an approved exempt plan or was exempt from the requirements of the PFML statute entirely | 7,649 applications |
| Eligibility | The applicant had not satisfied the financial eligibility test under M.G.L. c. 175M in that they did not earn 30 times their weekly benefit amount over the 12 months preceding the individual’s application | 3,591 applications |
| Eligibility | The applicant had wages too low to qualify for PFML | 1,698 applications |
| Eligibility | The applicant was ineligible due to being unemployed for more than 26 weeks at the time they applied | 109 applications |
| Documentation | The applicant did not submit the required documents | 7,559 applications |
| Documentation | The documents submitted by the applicant did not comply with DFML requirements | 3,807 applications |
| Information from employers | The employer provided disqualifying information about the applicant to DFML (e.g., that applicant had taken prior leave during the benefit year) | 442 applications |
| Information from employers | The employer was not notified by the applicant of their need for leave in accordance with the timeliness requirements established under M.G.L. c. 175M | 222 applications |
| Family leave | The leave did not fall within one year of the child’s birth or placement | 103 applications |
| Family leave | The applicant did not establish that they were caring for a covered family member | 12 applications |
| Family leave | The applicant applying for benefits or the family member they were caring for passed away prior to the start of the leave | 9 applications |
| Other | The application was submitted more than 90 days after the leave began | 894 applications |
| Other | The requested leave exceeded the amount allowed for family leave | 804 applications |
| Other | The requested leave exceeded the amount allowed for medical leave | 685 applications |
| Other | The requested leave exceeded the total allowed for both family and medical leave | 234 applications |
| Other | The application contained false statements | 45 applications |
Abandoned Claims
In FY23, of the 7,559 applications that were denied for “The applicant did not submit the required documents”, 3,948 applications were denied because an individual started an application in the portal but did not complete and submit the application.
Demographics for approved covered individuals
*Demographic information is provided for all covered individuals with approved leaves.
Age**
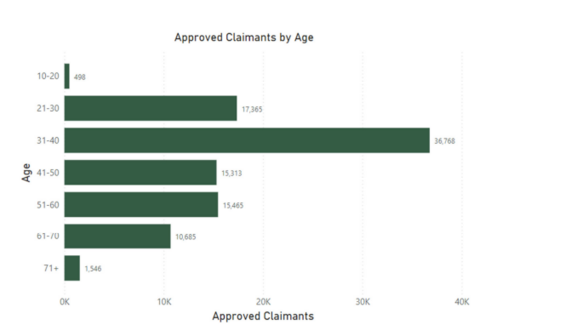
**The total number of covered individuals does not equal the total number of approved claims because covered individuals can file for multiple leaves within a year.
| Age | Approved Claimants |
|---|---|
| 10-20 | 498 |
| 21-30 | 17,365 |
| 31-40 | 36,768 |
| 41-50 | 15,313 |
| 51-60 | 15,465 |
| 61-70 | 10,685 |
| 71+ | 1,546 |
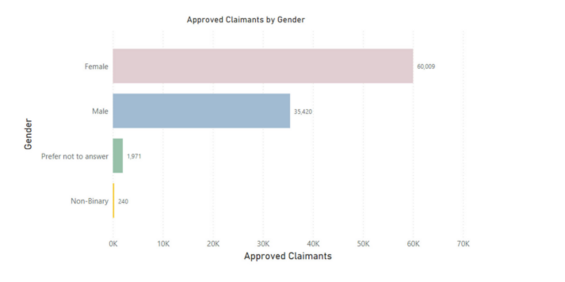
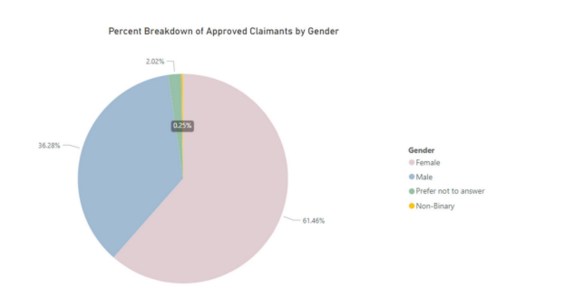
Gender
Demographic information for gender is optional for covered individuals to disclose to DFML. In FY23,61.46% (60,009) of covered individuals identified as female, 36.28% (35,420) of covered individuals identified as male, 2.02% (1,971) of covered individuals preferred not to answer, and0.25% (240) identified as non-binary.
| Gender | Approved Claimants |
|---|---|
| Female | 60,009 |
| Male | 35,420 |
| Prefer not to answer | 1,971 |
| Non-Binary | 240 |
| Gender | Percentage |
|---|---|
| Female | 61.46% |
| Male | 36.28% |
| Prefer not to answer | 2.02% |
| Non-Binary | 0.25% |
Race
Demographic information for race is optional for covered individuals to disclose to DFML. In total, 48% (46,874) of covered individuals preferred not to answer. After excluding covered individuals that preferred not to answer, 74.64% (37,894) of covered individuals selected White as their race; 11.42% (5,795) of covered individuals selected Black/African as their race; 6.38% (3,238) of covered individuals selected Asian/Asian American as their race;3.56% (1,806) of covered individuals selected “Another Race not Listed Above” as their race;3.42% (1,735) of covered individuals selected Multiracial as their race; and less than 1% (298) of covered individuals selected American Indian/Alaska Native or Native Hawaiian/Other Pacific Islander as their race.
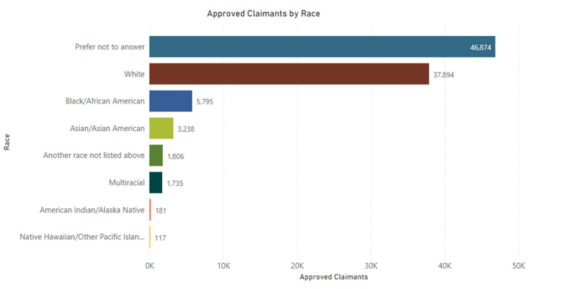
| Race | Approved Claimants |
|---|---|
| Prefer not to answer | 46,874 |
| White | 37,894 |
| Black/African American | 5,795 |
| Asian/Asian American | 3,238 |
| Another race not listed above | 1,806 |
| Multiracial | 1,735 |
| American Indian/Alaska Native | 181 |
| Native Hawaiian/Other Pacific Islander | 117 |
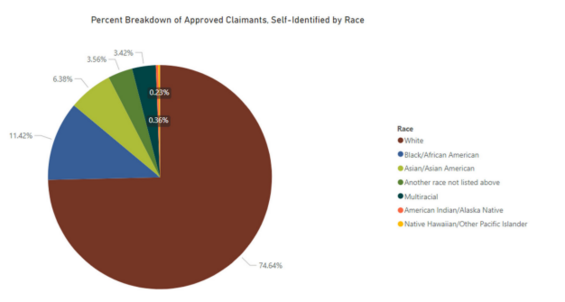
| Race | Percentage |
|---|---|
| White | 74.64% |
| Black/African American | 11.42% |
| Asian/Asian American | 6.38% |
| Another race not listed above | 3.56% |
| Multiracial | 3.42% |
| American Indian/Alaska Native | 0.36% |
| Native American/Other Pacific Islander | 0.23% |
Occupation
Covered individuals for paid leave worked in a wide variety of industries, and the top 40 occupations are listed below. This data is derived from occupational information that employers self-disclosed to the Department of Unemployment Assistance.
| Occupation | Approved Claimants |
|---|---|
| Waiters and Waitresses | 412 |
| Retail Salesperson | 403 |
| Cashiers | 400 |
| Personal Care Aides | 361 |
| Nursing Assistants | 355 |
| Sales Managers | 319 |
| Medical Assistants | 289 |
| First-Line Supervisors of Retail Sales Workers | 282 |
| Stock Clerks and Order Fillers | 266 |
| Preschool Teachers Except Special Education | 211 |
| Bus Drivers School or Special Client | 209 |
| Medical Secretaries and Administrative Assistants | 207 |
| Combined Food Preparation and Serving Workers Including Fast Food | 201 |
| Home Health Aides | 200 |
| Maids and Housekeeping Cleaners | 196 |
| Cooks Restaurant | 195 |
| Dental Assistants | 189 |
| Electricians | 189 |
| Licensed Practical and Licensed Vocational Nurses | 183 |
| Construction Laborers | 181 |
| Social and Human Service Assistants | 181 |
| Laborers and Freight Stock and Material Movers Hand | 177 |
| Bartenders | 173 |
| Heavy and Tractor-Trailer Truck Drivers | 165 |
| Food Service Managers | 162 |
| Light Truck Drivers | 155 |
| Packers and Packagers Clerks | 154 |
| Receptionists and Information Clerks | 153 |
| Carpenters | 149 |
| Hairdressers Hairstylists and Cosmetologists | 149 |
| Secretaries and Administrative Assistants Except Legal Medical and Executive | 142 |
| Janitors and Cleaners Except Maids and Housekeeping Cleaners | 140 |
| Sales Representatives Wholesale and Manufacturing Except Technical and Scientific Products | 132 |
| Security Guards | 130 |
| Dental Hygienists | 129 |
| Office Clerks General | 129 |
| Team Assemblers | 122 |
| First-Line Supervisors of Food Preparation and Serving Workers | 119 |
Geography
The below figure shows utilization of PFML by county. Since population size varies by county, the data is presented on a scale of number of approved claims per 1,000 residents in each county. The darker colors indicate more claims submitted versus the lighter colors which indicate fewer claims submitted per 1,000 residents. 13.60 % of claims were submitted with an out-of-state mailing address.
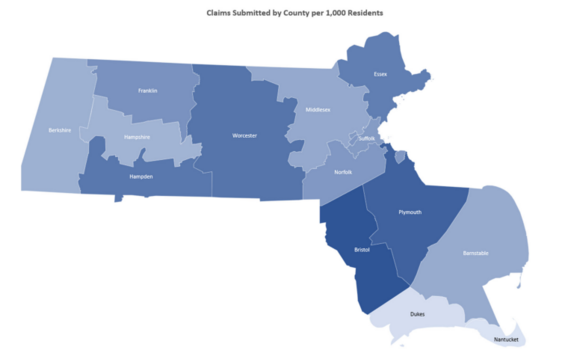
| County | Claims per 1,000 residents |
|---|---|
| Barnstable | 15.12 |
| Berkshire | 14.59 |
| Bristol | 24.01 |
| Dukes | 9.90 |
| Essex | 19.71 |
| Franklin | 17.68 |
| Hampden | 20.39 |
| Hampshire | 14.28 |
| Middlesex | 15.39 |
| Nantucket | 9.40 |
| Norfolk | 17.08 |
| Plymouth | 22.52 |
| Suffolk | 16.68 |
| Worcester | 20.76 |
Weekly wages
The average Individual Average Weekly Wage (IAWW) for PFML approved claims was $1,155.48.
- In FY22, the Individual Average Weekly Wage (IAWW) for PFM approved claims was $1,421.80, representing an 18.70% decrease in the average wage of approved PFML applicants from FY22 to FY23.
Average weekly benefit
During FY23, the average weekly benefit was:
- $774.01 for family leave. In FY22, the average weekly benefit for family leave was $793.55.
- $791.36 for medical leave. In FY22, the average weekly benefit for medical leave was $754.84.
Processing times
To apply for paid leave benefits, a covered individual must submit an application and upload supporting documentation. The application is then sent to their employer, which has 10 business days to review and respond. After the employer responds, or the 10 business days have lapsed, the application is adjudicated by DFML, and a decision is reached within 14 business days.
- The median response time from employers was 3 calendar days.
- In FY22, the median response time from employers was 2.75 calendar days.
- The median initial determination (from application submission to initial decision) was 17 calendar days.
- The median initial determination was unchanged from FY22 to FY23. In FY22, the median initial determination was 17 calendar days.
- The median final determination (from application submission to final decision, including the appeals process) was 27 calendar days.
- That represents a decrease of 27% from FY22, when the median final determination was 37 calendar days.
Leave durations
Assuming a five-day work week, the average duration of a leave completed in FY23 was 9.40 weeks.
- For medical leave, the median duration of a leave completed in FY23 was 8.74 weeks.
- For family leave, the median duration of a leave completed in FY23 was 10.44 weeks.
Open cases
At the end of FY23, there were 25,455 open leave requests, where covered individuals were in the midst of taking their leave. There were 117,844 closed leave requests, where the leave had been completed.
At the end of FY22, there were 25,718 open leave requests, where covered individuals were in the midst of taking their leave. There were 96,900 closed leave requests, where the leave had been completed.
Total benefits distributed
In FY23 (July 1, 2022-June 20, 2023), DFML paid out a total of $832,556,023.75 in family and medical leave benefits.
- In FY22 (July 1, 2021-June 20, 2022), DFML paid out a total of $602,767,692.31in family and medical leave benefits, which resulted in a 37% increase in total benefits paid between FY22 and FY23.
Employer Reimbursement
Employers may qualify for reimbursement of benefits paid to their employees if they offer a paid temporary disability, family or medical leave policy, or an extended illness leave bank that provides equal or more generous benefits than those provided under the PFML law.
In FY23 DFML paid out a total of $1,316,929.75 in family and medical leave reimbursements across 109 employers. The total employer reimbursement payment is included in the total benefit’s distributed for FY23.
- $692,766.37 for family leaves
- $624,163.38 for medical leaves
Previous fiscal year comparison at a glance
| Metric | FY22* | FY23 | Percent Change |
|---|---|---|---|
| Approved Applications | 112,531 | 143,256 | 27.39% Increase |
| Average Leave Duration | 12 Weeks | 9.40 Weeks | 21.66% Decrease |
| Average Weekly Benefit - Family Leave | $793.55 | $774.01 | 2.46% Decrease |
| Average Weekly Benefit - Medical Leave | $754.84 | $791.36 | 4.84% Increase |
| Calendar Days to Final Determination | 37 Calendar Days | 27 Calendar Days | 27.03% Decrease |
| Calendar Days to Initial Determination | 17 Calendar Days | 17 Calendar Days | 0% Change |
| Covered Individuals | 79,898 | 97,640 | 22.21% Increase |
| Denial Rate | 19.64% | 16.28% | 17.16% Decrease |
| Denied Applications | 27,507 | 27,863 | 1.30% Increase |
| Individual Average Weekly Wage | $1,421.80 | $1,155.48 | 18.73% Decrease |
| Total Applications | 140,038 | 171,219 | 22.26% Increase |
| Total Benefits Paid Out | $602,767,692.31 | $832,548,618.16 | 38.12% Increase |
*FY22 was the department’s first full operational fiscal year.
Fiscal Year Improvements
The Department saw an increase of 27.39% in approved applications in FY23:
- The increase in approved applications was brought on by a 22.26% increase in total applications and a 17.16% decrease in the percentage of applications that were denied.
- The 17.16% decrease in the percentage of applications that were denied was the result of a decrease in the percentage of applications that were denied for insufficient documentation.
- Despite claims increasing by 22.26%, the overall number of applications denied for having insufficient documentation decreased by 45.5%.
The number of unique covered individuals accessing PFML benefits increased by 22.21%.
The Department issued final determinations faster, reducing the average time it takes to issue a final determination by 10 calendar days.
- Overall, there was a 27.03% decrease in the time it takes the Department to issue a final determination.
The average wage for a covered individual decreased by 18.73%.
| Date published: | February 7, 2023 |
|---|