Information on Approved Applications in FY24:
Approved application data is based on application approvals that occurred between July 1, 2023, and June 30, 2024 (FY24).
In FY24:
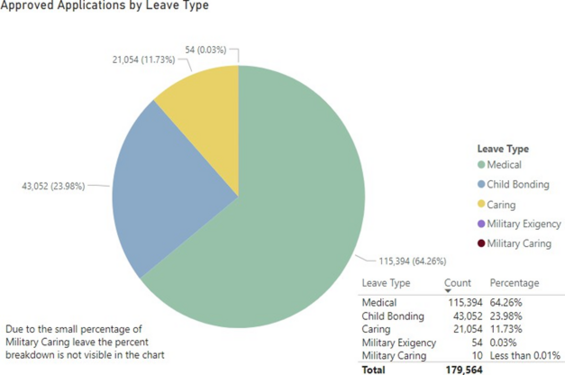
- Total applications approved: 179,564
- Applications were approved for 117,152 unique individuals. (This number is lower than total applications because applicants can file for multiple leaves within a benefit year.)
- Applications approved for medical leave: 115,394 (64.26% of total approved applications)
- Medical leave for one’s own serious health condition, other than medical leave related to childbirth or pregnancy, accounted for 51.43% of approved applications (92,354 approved applications).
- Medical leave associated with recovery from childbirth or pregnancy accounted for 12.83% of approved applications (23,040 approved applications).
- Applications approved for family leave to care for a family member with a serious health condition: 21,054 (11.73% of total approved applications)
- Applications approved for family leave to bond with a child following birth, adoption or foster care placement: 43,052 (23.98% of total approved applications)
- Applications approved for military exigency leave: 54 (.03% of total approved applications)
- Applications approved for family leave to care for a covered military service member: 10 (less than .01% of total approved applications)
| Leave Type | Count | Percentage |
|---|---|---|
| Medical | 115,394 | 64.26% |
| Child Bonding | 43,052 | 23.98% |
| Caring | 21,054 | 11.73% |
| Military Exigency | 54 | 0.03% |
| Military Caring | 10 | Less than 0.01% |
| Total | 179,564 |
Demographics for Approved Covered Individuals
Age
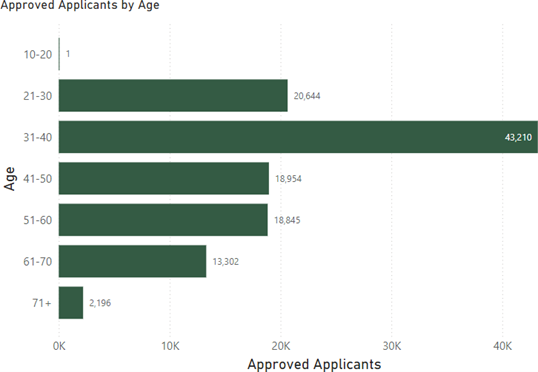
Covered individuals are required to disclose demographic information for age to DFML. In FY24 the primary age group for covered individuals was the 31-40 range, which accounted for 36.88% of the total approved covered individuals.
| Age | Approved Applicants |
|---|---|
| 10-20 | 1 |
| 21-30 | 20,644 |
| 31-40 | 43,210 |
| 41-50 | 18,954 |
| 51-60 | 18,845 |
| 61-70 | 13,302 |
| 71+ | 2,196 |
Gender
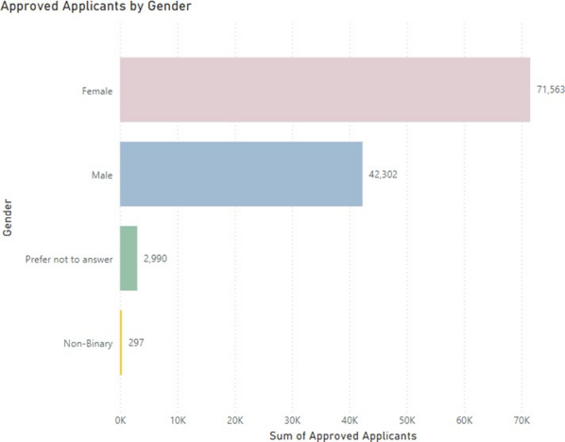
Covered individuals are not required to disclose demographic information for gender to DFML. In FY24, 61.09% (71,563) of covered individuals identified as female, 36.11% (42,302) of covered individuals identified as male, 2.55% (2,990) of covered individuals preferred not to answer, and 0.25% (297) identified as non-binary.
| Gender | Approved Applications |
|---|---|
| Female | 71,563 |
| Male | 42,302 |
| Prefer not to answer | 2,990 |
| Non-Binary | 297 |
Race
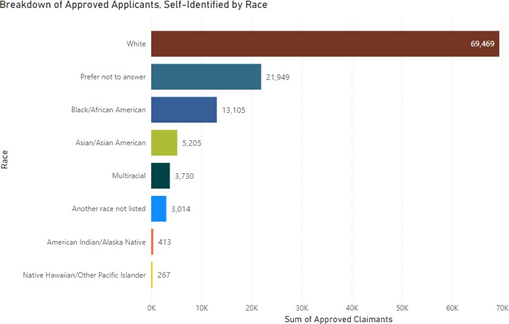
Covered individuals are not required to disclose demographic information for race to DFML. In total, 18.74% (21,949) of covered individuals preferred not to answer. After excluding covered individuals that preferred not to answer, 59.30% (69,469) of covered individuals selected White as their race; 11.19% (13,105) of covered individuals selected Black/African as their race; 4.44%% (5,205) of covered individuals selected Asian/Asian American as their race; 2.57% (3,014) of covered individuals selected “Another Race not Listed” as their race; 3. 18% (3,730) of covered individuals selected Multiracial as their race; and less than 1% (680) of covered individuals selected American Indian/Alaska Native or Native Hawaiian/Other Pacific Islander as their race.
| Race | Approved Applicants |
|---|---|
| White | 69,469 |
| Prefer not to answer | 21,949 |
| Black/African American | 13,105 |
| Asian/Asian American | 5,205 |
| Multiracial | 3,730 |
| Another race not listed | 3,014 |
| American Indian/Alaska Native | 413 |
| Native Hawaiian/Other Pacific Islander | 267 |
Language
Since the launch of increased language access in 2023, 3.82% of total covered individuals have applied and received notices in Spanish, Portuguese, Haitian Creole, or Chinese.
Occupation
Covered individuals who were approved for paid leave worked in a wide variety of industries. The top industries are listed below. This data is derived from occupational information that employers self-disclosed to the Department of Unemployment Assistance.
| Occupation | Sum of Approved Applicants |
|---|---|
| General Medical and Surgical Hospitals | 13,414 |
| Offices of Physicians (except Mental Health Specialists) | 4,291 |
| Other General Government Support | 3,907 |
| Supermarkets and Other Grocery Retailers (except Convenience Retailers) | 2,820 |
| Nursing Care Facilities (Skilled Nursing Facilities) | 2,618 |
| Undisclosed | 2,509 |
| Home Health Care Services | 1,865 |
| Full-Service Restaurants | 1,849 |
| Scheduled Passenger Air Transportation | 1,691 |
| Other Individual and Family Services | 1,690 |
| Child Care Services | 1,644 |
| Services for the Elderly and Persons with Disabilities | 1,590 |
| Specialty (except Psychiatric and Substance Abuse) Hospitals | 1,549 |
| Offices of Dentists | 1,515 |
| Administrative Management and General Management Consulting Services | 1,407 |
| Residential Intellectual and Developmental Disability Facilities | 1,406 |
| Residential Mental Health and Substance Abuse Facilities | 1.320 |
| Warehouse Clubs and Supercenters | 1,286 |
| Temporary Help Services | 1,211 |
| Outpatient Mental Health and Substance Abuse Centers | 1,071 |
In addition to the categories listed above, responses in “other occupations” account for 66,499 respondents.
Geography
The below figure shows utilization of PFML by county. Since population size varies by county, the data is presented on a scale of number of approved applications per 1,000 residents in each county. The darker colors indicate more approved applications versus the lighter colors which indicate fewer approved applications per 1,000 residents. There were 15,229 approved applications that were submitted with an out-of-state mailing address.
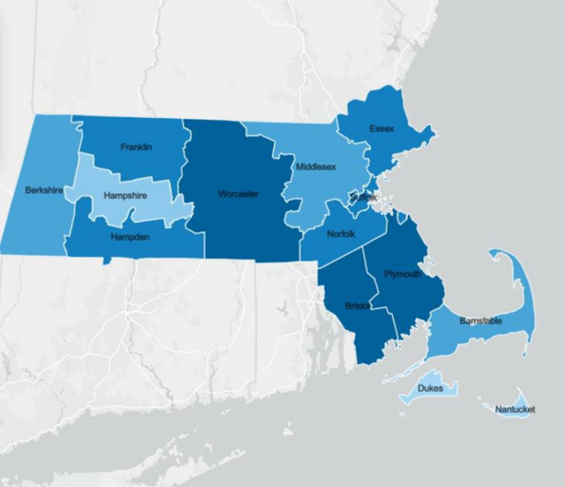
| County | Approved Applications per 1,000 Residents | Percentage of Total Approved Applications |
|---|---|---|
| Barnstable | 21.48 | 2.47% |
| Berkshire | 21.35 | 1.42% |
| Bristol | 33.45 | 9.71% |
| Dukes | 12.57 | 0.14% |
| Essex | 26.25 | 10.90% |
| Franklin | 22.84 | 0.88% |
| Hampden | 28.02 | 6.62% |
| Hampshire | 18.90 | 1.63% |
| Middlesex | 20.68 | 17.67% |
| Nantucket | 12.56 | 0.10% |
| Norfolk | 22.68 | 8.50% |
| Plymouth | 30.09 | 8.12% |
| Suffolk | 23.05 | 9.55% |
| Worcester | 31.23 | 13.86% |
Information on Denied Applications in FY24
Total applications denied: 32,323
Percentage of all filed applications that were denied: 15.25%
Reasons for Denied Applications: The following categories accounted for the denials issued by DFML in FY24:
| Category | Description | No. Applications |
|---|---|---|
| Eligibility | The applicant’s employer was not identified as participating in the PFML program, for reasons that include coverage by an approved exempt plan or exclusion from the requirements of the PFML statute | 6,863 applications |
| Eligibility | The applicant’s employer could not be located using tax filing data | 2,350 applications |
| Eligibility | The employee had not satisfied the financial eligibility test under M.G.L. c. 175M in that they did not earn 30 times their weekly benefit amount over the 12 months preceding the individual's application | 3,001 applications |
| Eligibility | The employee had wages too low to qualify for PFML | 3,227 applications |
| Eligibility | The person was ineligible due to being unemployed for more than 26 weeks at the time they applied | 217 applications |
| Documentation | The applicant did not complete the application or did not submit the required documents | 6,745 applications |
| Documentation | The documents submitted by the applicant did not comply with DFML requirements | 4,985 applications |
| Information from employers | The employer provided disqualifying information about the applicant to DFML (e.g., that applicant had taken prior leave during the benefit year) | 575 applications |
| Information from employers | Employer was not notified by the employee of their need for leave in accordance with the timeliness requirements established under M.G.L. c. 175M | 285 applications |
| Family leave | The leave did not fall within one year of the child’s birth or placement | 103 applications |
| Family leave | The applicant did not establish that they were caring for a covered family member | 12 applications |
| Family leave | The applicant applying for benefits or the family member they were caring for passed away prior to the start of the leave | 9 applications |
| Other | The application was submitted more than 90 days after the leave began | 894 applications |
| Other | The requested leave exceeded the amount allowed for family leave | 804 applications |
| Other | The requested leave exceeded the amount allowed for medical leave | 685 applications |
| Other | The requested leave exceeded the total allowed for both family and medical leave | 234 applications |
| Other | The application contained false statements | 45 applications |
Abandoned Applications
In FY24, of the 6,745 applications reported above as denied for the reason that the applicant did not complete the application or did not submit the required documents, 6,183 of those applications were denied because an individual started an application on the website but did not complete and submit the application.
Average Weekly Benefit
During FY24, the average weekly benefit was: $848.83
- $892.31 for family leave
- $824.63 for medical leave
Total Benefits Distributed Year Over Year
In FY24 (July 1, 2023-June 30, 2024), DFML paid out a total of $1,049,721,590.56 in family and medical leave benefits.
In FY23 (July 1, 2022-June 30, 2023), DFML paid out a total of $832,548,618.16 in family and medical leave benefits.
In FY22 (July 1, 2021-June 30, 2022), DFML paid out a total of $602,767,692.31 in family and medical leave benefits.
In FY21 (January 1, 2021-June 30, 2021), DFML paid out a total of $174,729,366.12 in family and medical leave benefits.
Previous Fiscal Year Comparison
- Increase in Approved Applications: 179,564 applications were approved in FY24. That represents a 25.26% increase in approved applications over FY23, when the department approved 143,356 applications.
- The increase in approved applications correlates with a 23.76% increase in total applications (approved and denied applications).
- The approval percentage for applications in FY24 increased by 1.02% to 84.75%.
- While the overall number of applications denied in FY24 was higher than in FY23 due to an overall increase in applications, the percentage of applications denied decreased in FY24 when compared to FY23.
- Increase in Approved Applicants: The number of unique covered individuals accessing PFML benefits increased by 19.98%.
- Increase in Approved Medical Leave Combined with Bonding Leave: In FY24, 74.10% of covered individuals with an approved medical leave claim to recover from childbirth or due to pregnancy also had an approved child bonding family leave claim which is an 11.22% increase from FY23.
- Improvement in Application Processing Time: The median time for an initial determination was reduced by 4 calendar days.
- Overall, there was a 30.77% decrease in the time for an initial determination, from a median of 17 calendar days in FY23 to a median of 13 calendar days in FY24.
- Improvement in Application Processing Time: The Department issued final determinations, including the time spent completing decision appeals, faster, reducing the median time it takes to issue a final determination by 9 calendar days.
- Overall, there was an 33.33% decrease in the time it takes the Department to issue a final determination, from a median of 27 calendar days in FY23 to a median of 18 calendar days in FY24.
| Metric | FY23 | FY24 | Percent Change |
|---|---|---|---|
| Approved Applications | 143,356 | 179,564 | 25.26% Increase |
| Average Leave Duration | 9.40 weeks | 8.66 weeks | 7.87% Decrease |
| Covered Individuals Who Took Leave | 97,640 | 117,152 | 19.98% Increase |
| Denial Rate | 16.28% | 15.26% | 6.27% Increase |
| Denied Applications | 27,863 | 32,330 | 16.03% Increase |
| Individual Average Weekly Wage - Average FN2 | $1,483.77 | $1,541.80 | 3.91% Increase |
| Individual Average Weekly Wage - Median | $1,189.60 | $1,222.00 | 5.76% Increase |
| Total Benefits Paid Out | $832,548,618.16 | $1,049,721,590.56 | 26.00% Increase |
Application Processing Times
To apply for paid leave benefits, a covered individual must submit an application and upload supporting documentation. The application is then sent to their employer, which has 10 business days to review and respond. After the employer responds or the 10 business days have lapsed, the application is adjudicated by DFML, and a decision is reached within 14 business days.
- The average response time from employers was 2.61 calendar days.
- The median initial determination (from application submission to initial decision) was 13 calendar days, which was a four full calendar day reduction from the FY23 median initial determination time. The median final determination (from application submission to final decision, including the appeal process) was 18 calendar days, which was a nine full calendar day reduction from the FY23 median final determination time.
Leave Duration
The average duration of a leave completed in FY24 was 8.66 weeks. FN3
- For medical leave, the average duration of a leave completed in FY24 was 8.57 weeks.
- For family leave, the average duration of a leave completed in FY24 was 8.85 weeks.
Open Cases
At the end of FY24, there were 35,261 open leaves, where covered individuals were in the midst of taking their leave. There were 144,303 approved completed leaves, where the leave had been completed.
Employer Reimbursement
Employers may qualify for reimbursement of benefits paid to their employees on or after January 1, 2021, if they offer a paid temporary disability, family or medical leave policy, or an extended illness leave bank that provides equal or more generous benefits than those provided under the PFML law.
In FY24 DFML paid out a total of $1,666,335.92 in family and medical leave reimbursements across 58 employers.
- $844,272.25 for family leaves
- $822,063.67 for medical leaves
Information on PFML Program Data
FN1. The data used in this report is derived from various sources, including DFML’s application processing system. Numbers for reported data may be rounded. The data reported in each fiscal year is accurate at the time of June 30 to the best of DFML’s knowledge. Any inconsistencies in year-over-year data, such as the rise in the number of approved and denied applications compared to prior fiscal year annual reports, can be attributed to several factors, including claims with an appeals process in the subsequent fiscal year, application extensions, and applications that were pending at the end of each fiscal year.
FN2. Comparative Individual Average Weekly Wage data is based on updated data and updates the average Individual Average Weekly Wage listed for FY23 PFML approved claims.
FN3. Note that in previous fiscal years leave duration was calculated based on a 5-day work week and excluded intermittent leave schedules. Leave duration for FY24 was calculated based on actual work weeks reported by applicants and includes intermittent leave hours.
As of June 30, 2024, total application data from the beginning of the PFML program consists of:
- 508,370 approved applications
- 104,347 denied applications
As of June 30, 2024, total benefit payments disbursed from the beginning of the PFML program is $2,659,768,219.40.
| Date published: | December 11, 2024 |
|---|