Information on Approved Applications in FY25:
Approved application data is based on approvals of PFML applications that occurred between July 1, 2024, and June 30, 2025 (FY25).
In FY25:
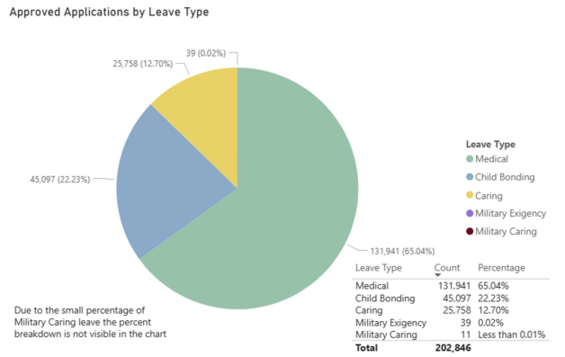
- Total applications approved: 202,846
- Applications were approved for 130,309 unique individuals. (This number is lower than total applications because applicants can file for multiple leaves within a single benefit year.)
- Applications approved for medical leave: 131,941 (65.04% of total approved applications)
- Medical leave for one’s own serious health condition, other than medical leave related to childbirth or pregnancy, accounted for 52.98% of approved applications (107,460 approved applications).
- Medical leave associated with recovery from childbirth or pregnancy accounted for 12.07% of approved applications (24,481 approved applications).
- Applications approved for family leave to care for a family member with a serious health condition: 25,758 (12.70%of total approved applications)
- Applications approved for family leave to bond with a child following birth, adoption or foster care placement: 45,097 (22.23% of total approved applications)
- Applications approved for military exigency leave: 39 (.02% of total approved applications)
- Applications approved for family leave to care for a covered military service member: 11 (less than .01%of total approved applications)
| Leave Type | Count | Percentage |
|---|---|---|
| Medical | 131,941 | 65.04% |
| Child Bonding | 45,097 | 22.23% |
| Caring | 25,758 | 12.70% |
| Military Exigency | 39 | 0.02% |
| Military Caring | 11 | Less than 0.01% |
| Total | 202,846 |
Demographics for Approved Covered Individuals
Age
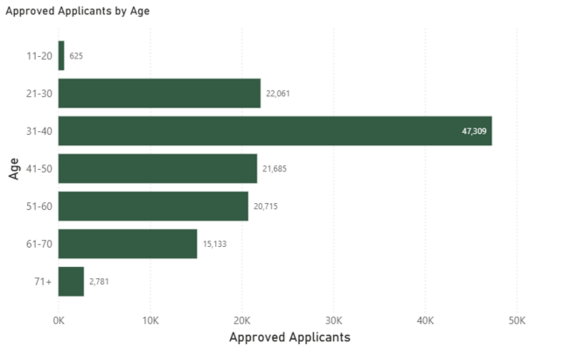
Covered individuals are required to disclose demographic information for age to DFML. In FY25 the primary age group for covered individuals was the 31-40 range, which accounted for 36.31% of the total approved covered individuals.
| Age | Approved Applicants |
|---|---|
| 11-20 | 625 |
| 21-30 | 22,061 |
| 31-40 | 47,309 |
| 41-50 | 21,685 |
| 51-60 | 20,715 |
| 61-70 | 15,133 |
| 71+ | 2,781 |
Gender
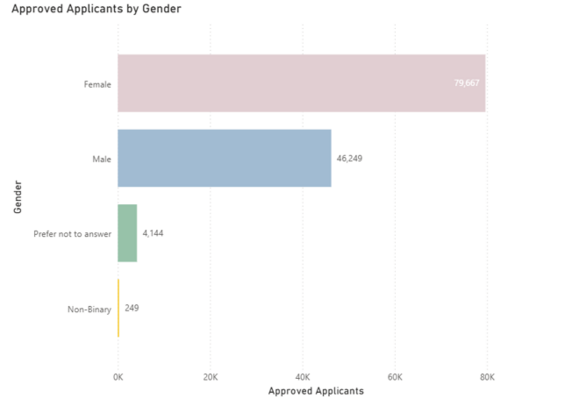
Covered individuals are not required to disclose demographic information for gender to DFML. In FY25, 61.14% (79,667) of covered individuals identified as female, 35.49% (46,249) of covered individuals identified as male, 3.18% (4,144) of covered individuals preferred not to answer, and 0.19% (249) identified as non-binary.
| Gender | Approved Applicants |
|---|---|
| Female | 79,667 |
| Male | 46,249 |
| Prefer not to answer | 4,144 |
| Non-Binary | 249 |
Race
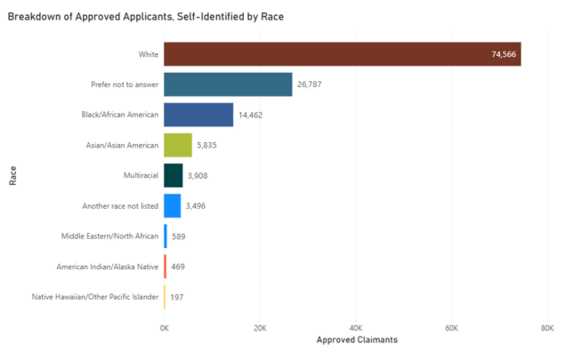
Covered individuals are not required to disclose demographic information for race to DFML. In total, 20.56% (26,787) of covered individuals preferred not to answer. After excluding covered individuals that preferred not to answer, 57.22% (74,566) of covered individuals selected White as their race; 11.10% (14,462) of covered individuals selected Black/African as their race; 4.48% (5,835) of covered individuals selected Asian/Asian American as their race; 2.68% (3,496) of covered individuals selected “Another Race not Listed” as their race; 3.00% (3,908) of covered individuals selected Multiracial as their race; and less than 1% (1255) of covered individuals selected American Indian/Alaska Native, Middle Eastern/North African or Native Hawaiian/Other Pacific Islander as their race.
| Race | Approved Claimants |
|---|---|
| White | 74,566 |
| Prefer not to answer | 26,787 |
| Black/African American | 14,462 |
| Asian/Asian American | 5,835 |
| Multiracial | 3,908 |
| Another race not listed | 3,496 |
| Middle Eastern/North African | 589 |
| American Indian/Alaska Native | 469 |
| Native Hawaiian/Other Pacific Islander | 197 |
Language
Since the launch of multilingual application options in 2023, 5.71% of applicants have applied and received notices in Spanish, Portuguese, Haitian Creole, Chinese, French, or Vietnamese.
Occupation
Covered individuals who were approved for paid leave worked in a wide variety of industries. The top industries are listed below.
| Occupation | Sum of Approved Applicants |
|---|---|
| General and Operations Managers | 1.835 |
| Customer Service Representatives | 1,791 |
| Registered Nurses | 1,579 |
| Retail Salespersons | 1,452 |
| Cashiers | 1,433 |
| Waiters and Waitresses | 1,364 |
| Nursing Assistants | 1,274 |
| Personal Care Aides | 1,261 |
| Sales Manager | 1,151 |
| Medical Secretaries and Administrative Assistants | 973 |
| Medical Assistants | 945 |
| Office Clerks General | 854 |
| First-Line Supervisors of Retail Sales Workers | 811 |
| Maids and Housekeeping Cleaners | 811 |
| Construction Laborers | 775 |
| Heavy and Tractor-Trailer Truck Drivers | 729 |
| Social and Human Service Assistants | 687 |
| Preschool Teachers Except Special Education | 679 |
| Light Truck Drivers | 663 |
| Home Health Aides | 647 |
In addition to the categories listed above, “other occupations” account for 108,595 approved applicants.
Geography
The below figure shows utilization of PFML by county. Since population size varies by county, the data is presented on a scale of number of approved applications per 1,000 residents in each county. The darker colors indicate more approved applications versus the lighter colors which indicate fewer approved applications per 1,000 residents. There were 16,641 approved applications that were submitted with an out-of-state mailing address.
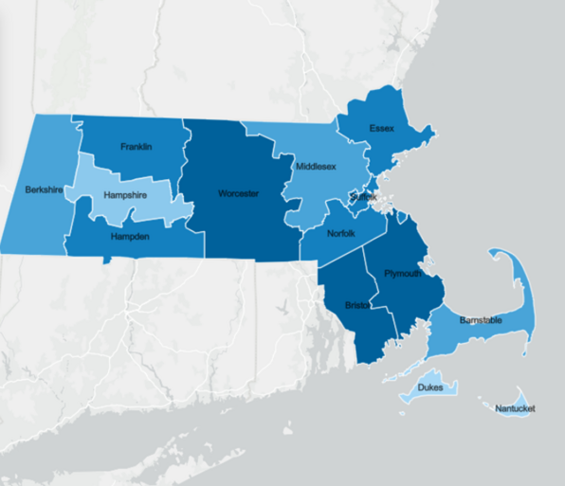
| County | Approved Applications per 1,000 Residents | Percentage of Total Approved Applications |
|---|---|---|
| Barnstable | 21.63 | 2.44% |
| Berkshire | 28.07 | 1.79% |
| Bristol | 33.21 | 9.48% |
| Dukes | 13.16 | 0.13% |
| Essex | 27.88 | 11.13% |
| Franklin | 24.37 | 0.85% |
| Hampden | 29.03 | 6.67% |
| Hampshire | 20.25 | 1.62% |
| Middlesex | 21.24 | 17.09% |
| Nantucket | 14.73 | 0.10% |
| Norfolk | 23.68 | 8.48% |
| Plymouth | 31.38 | 8.21% |
| Suffolk | 25.10 | 9.87% |
| Worcester | 32.77 | 13.93% |
Information on Denied Applications in FY25
Total applications denied: 35,964
Percentage of all filed applications that were denied: 15.06%
Reasons for Denied Applications
The following categories accounted for the denials issued by DFML in FY25:
| Category | Description | No. Applications |
|---|---|---|
| Eligibility | The applicant’s employer was not identified as participating in the PFML program, for reasons that include coverage by an approved exempt plan or exclusion from the requirements of the PFML statute | 7,983 applications |
| Eligibility | The applicant’s employer could not be located using tax filing data | 3,578 applications |
| Eligibility | The employee had not satisfied the financial eligibility test under M.G.L. c. 175M in that they did not earn 30 times their weekly benefit amount over the 12 months preceding the individual's application | 2,381 applications |
| Eligibility | The employee had wages too low to qualify for PFML | 3,877 applications |
| Eligibility | The person was ineligible due to being unemployed for more than 26 weeks at the time they applied | 228 applications |
| Documentation | The applicant did not complete the application or did not submit the required documents | 7,181 applications |
| Documentation | The documents submitted by the applicant did not comply with DFML requirements | 5,122 applications |
| Information from employers | Employer provided disqualifying information about the applicant to DFML (e.g., that applicant had taken prior leave during the benefit year) | 745 applications |
| Information from employers | Employer was not notified by the employee of their need for leave in accordance with the timeliness requirements established under M.G.L. c. 175M | 335 applications |
| Family leave | The leave did not fall within one year of the child’s birth or placement | 155 applications |
| Family leave | The person applying did not establish that they were caring for a covered family member | 31 applications |
| Other | The application was submitted more than 90 days after the leave began | 314 applications |
| Other | The requested leave exceeded the amount allowed for family leave | 1,221 applications |
| Other | The requested leave exceeded the amount allowed for medical leave | 1,481 applications |
| Other | The requested leave exceeded the total allowed for both family and medical leave | 98 applications |
| Other | The application contained false statements | 1,221 applications |
Abandoned Applications
In FY25, of the 7,181 applications reported above as denied for the reason of 'the applicant did not complete the application or did not submit the required documents', 5,597 of those applications were denied because an individual initiated their application on the website but did not complete and submit their application. The remaining 1,584 applications were denied because the applicant submitted their application but did not submit their certification documents within 90 days.
Average Weekly Benefit
During FY25, the average weekly benefit was: $866.11
- $910.23 for family leave
- $842.87 for medical leave
Total Benefits Distributed Year Over Year
| Fiscal Year | Total of family and medical leave benefits paid out by DFML |
|---|---|
| FY25 (July 1, 2024-June 30, 2025) | $1,241,998,293.24 |
| FY24 (July 1, 2023-June 30, 2024) | $1,049,721,590.56 |
| FY23 (July 1, 2022-June 30, 2023) | $832,548,618.16 |
| FY22 (July 1, 2021-June 30, 2022) | $602,767,692.31 |
| FY21 (January 1, 2021-June 30, 2021) | $174,729,366.12 |
Previous Fiscal Year Comparison
- Increase in Approved Applications: 202,846 applications were approved in FY25. That represents a 12.97% increase in approved applications over FY24, when the department approved 179,564 applications.
- The increase in approved applications correlates with a 12.70% increase in total applications (approved and denied applications).
- The approval percentage for applications in FY25 increased by 0.19% to 84.94%.
- While the overall number of applications denied in FY25 was higher than in FY24 due to an overall increase in applications, the percentage of applications denied decreased in FY25 when compared to FY24.
- Increase in Approved Applicants: The number of unique covered individuals accessing PFML benefits increased by 10.10%.
- Approved Medical Leave Combined with Bonding Leave: In FY25, 69.09% of covered individuals with an approved medical leave application to recover from childbirth or due to pregnancy also had an approved child bonding family leave application, compared to 74.10% in FY24.
- Improvement in Application Processing Time: The median time for an initialdetermination was reduced by 4 calendar days.
- Overall, there was a 30.77% decrease in the time for an initial determination, from a median of 13 calendar days in FY24 to a median of 11 calendar days in FY25.
- Improvement in Application Processing Time: The Department issued final determinations, including the time spent completing decision appeals, faster, reducing the median time it takes to issue a final determination by 7 calendar days.
- Overall, there was an 38.89% decrease in the time it took the Department to issue a final determination, from a median of 18 calendar days in FY24 to a median of 11 calendar days in FY25.
| Metric | FY24 | FY25 | Percent Change |
|---|---|---|---|
| Approved Applications | 179,564 | 202,846 | 12.97% Increase |
| Average Leave Duration | 8.66 weeks | 8.45 weeks | 2.42% Decrease |
| Covered Individuals Who Took Leave | 117,152 | 130,309 | 11.23% Increase |
| Denial Rate | 15.26% | 15.06% | 1.31% Decrease |
| Denied Applications | 32,330 | 35,964 | 11.24% Increase |
| Individual Average Weekly Wage - Average | $1,541.80 | $1,583.00 | 2.67% Increase |
| Individual Average Weekly Wage - Median | $1,222.00 | $1,251.00 | 2.37% Increase |
| Total Benefits Paid Out | $1,049,721,590.56 | $1,241,998,293.24 | 18.32% Increase |
Application Processing Times
To apply for paid leave benefits, a covered individual must submit an application with supporting documentation. The application is then sent to their employer, which has 10 business days to review and respond. After the employer responds or the 10 business days have lapsed, the application is adjudicated by DFML, and a decision is reached within 14 business days.
- The average response time from employers was 2.69 calendar days.
- The median initial determination (from application submission to initial decision) was 9 calendar days, which was a two full calendar day reduction from the FY24 median initial determination time. The median final determination (from application submission to final decision, including the appeal process) was 11 calendar days, which was a seven full calendar day reduction from the FY24 median final determination time.
Leave Duration
The average duration of a leave completed in FY25 was 8.45 weeks. FN2
- For medical leave, the average duration of a leave completed in FY25 was 8.16 weeks.
- For family leave, the average duration of a leave completed in FY25 was 9.04 weeks.
Open Cases
At the end of FY25, there were 41,971 open leaves, where covered individuals were in the midst of taking their leave. There were 160,875 approved completed leaves, where the leave had been completed.
Employer Reimbursement
Employers may qualify for reimbursement of benefits paid to their employees on or after January 1, 2021, if they offer a paid temporary disability, family or medical leave policy, or an extended illness leave bank that provides equal or more generous benefits than those provided under the PFML law.
In FY25 DFML paid out a total of $1,803,574.22 in family and medical leave reimbursements across 50 employers.
- $835,796.04 for family leaves
- $967,778.18 for medical leaves
Information on PFML Program Data
FN1. The data used in this report is derived from various sources, including DFML’s application processing system. Numbers for reported data may be rounded. The data reported in each fiscal year is accurate at the time of June 30 to the best of DFML’s knowledge. Any inconsistencies in year-over-year data, such as the rise in the number of approved and denied applications compared to prior fiscal year annual reports, can be attributed to several factors, including applications with an appeals process in the subsequent fiscal year, application extensions, and applications that were pending at the end of each fiscal year.
FN2. Note that in fiscal years FY23 and prior, leave duration was calculated based on a 5-day work week and excluded intermittent leave schedules. Beginning in FY24, and including FY25, leave duration was calculated based on actual work weeks reported by applicants and includes intermittent leave hours.
As of June 30, 2025, total application data from the beginning of the PFML program consists of:
- 711,216 approved applications
- 140,311 denied applications
As of June 30, 2025, the total of benefit payments disbursed from the beginning of the PFML program is $3,901,766,512.64.
| Date published: | December 1, 2025 |
|---|