Authors: Tom Guilfoyle - Bureau of Accounts, Tony Rassias - Deputy Director of Accounts
This article reviews property tax levies and assessed values for all 351 communities from FY2016 to FY2025. For the 343 communities with FY2026 tax rates approved by the Division of Local Services’ (DLS) Bureau of Accounts as of January 1, 2026, the article compares FY2025 and FY2026 tax levies and assessed values and then provides some quick FY2026 stats. It then reviews whether communities are close to their FY2026 levy limits and ceilings. Finally, it reports on tax rates and shifts between property classes. For trainings and informational resources about property taxes and related content, please visit the Property Taxes and Proposition 2½ Training and Resources page. In additions, DLS provides a variety of data reports associated with this article.
Tax Levies
The property tax levy is the annual amount of taxes assessed upon real and personal property in the community. For the vast majority of communities, the property tax levy is the largest revenue source. Along with other revenue sources such as estimated receipts and available reserves, these revenues balance the spending needs voted in the omnibus budget. Since FY1982, the property tax levy has been subject to the limits of Prop 2½.
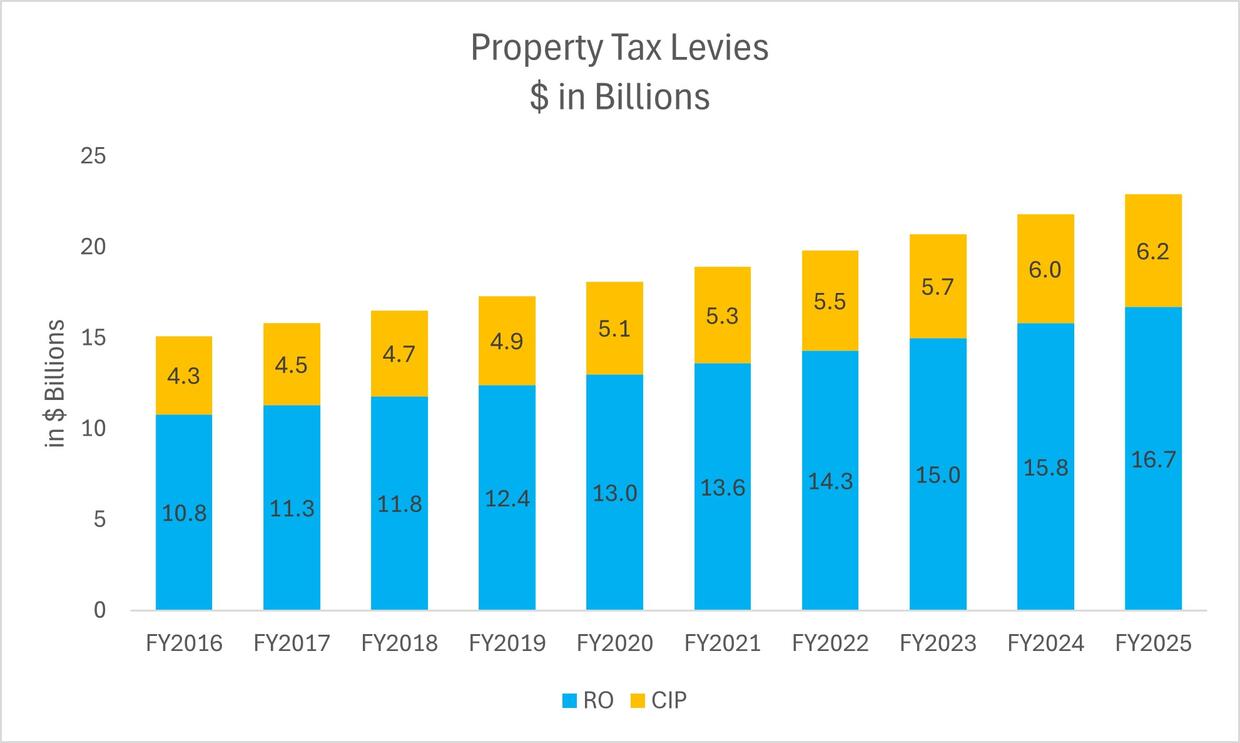
The graph below shows property tax levies for the residential and open space (RO) classes as well as the commercial, industrial and personal property (CIP) classes for FY2016 to FY2025. Tax levies grew by 50.6% or by $7.7 billion, from $15.2 billion to $22.9 billion over this time.
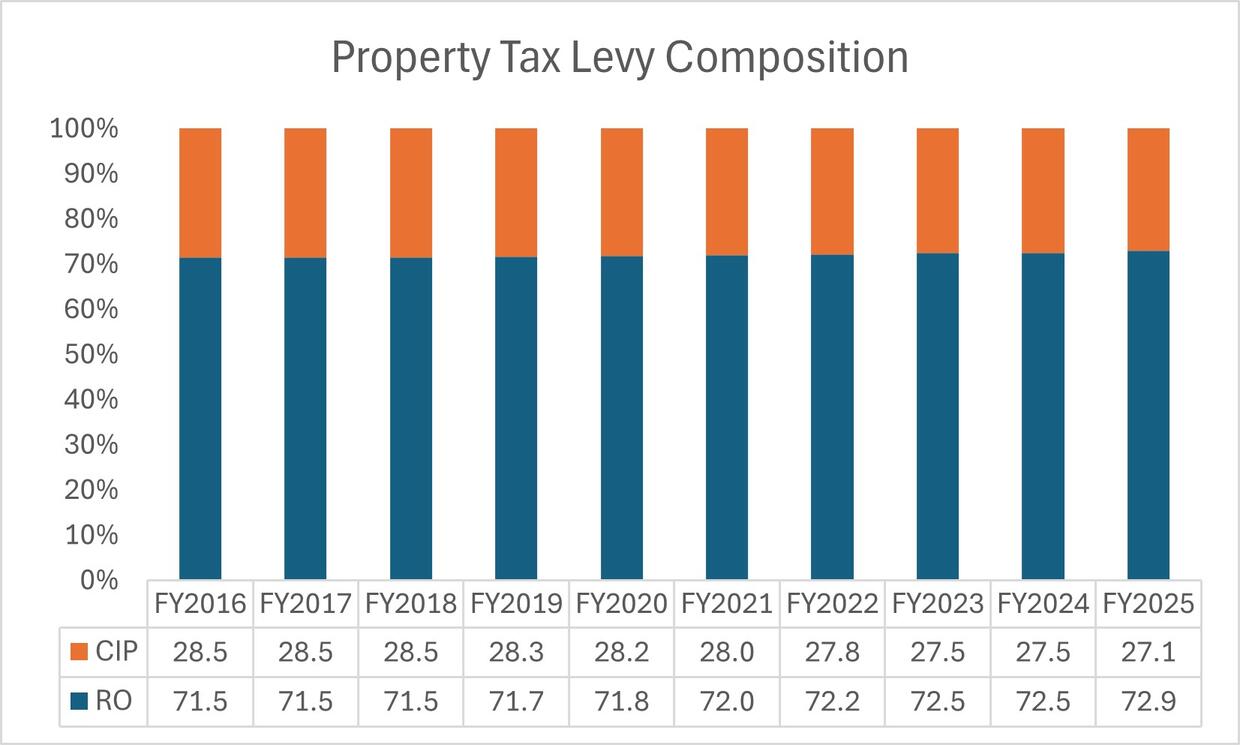
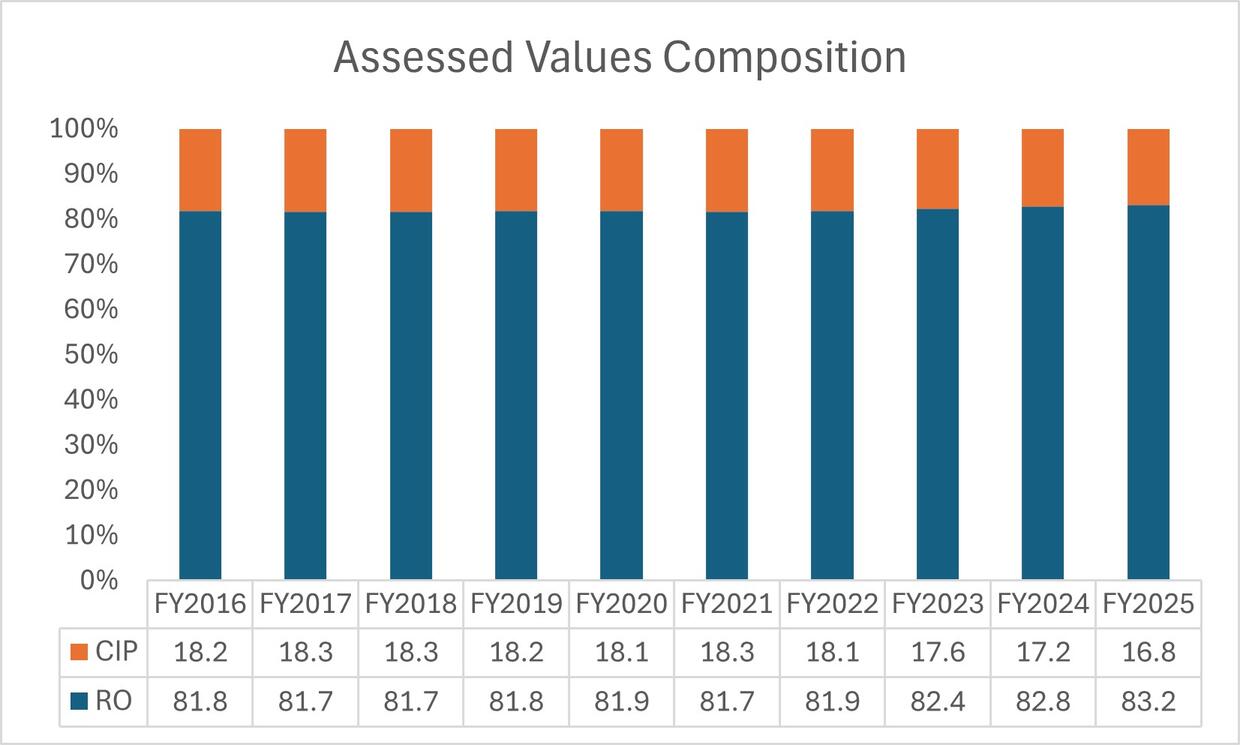
Overall percentages of the tax levy by the respective class groupings from FY2016 to FY2025 are seen in the following chart.
The graph below shows that for the 343 communities with certified FY2026 tax rates, tax levies increased from FY2025 to FY2026 ($1.2 billion) from $22.8 billion to $24 billion.
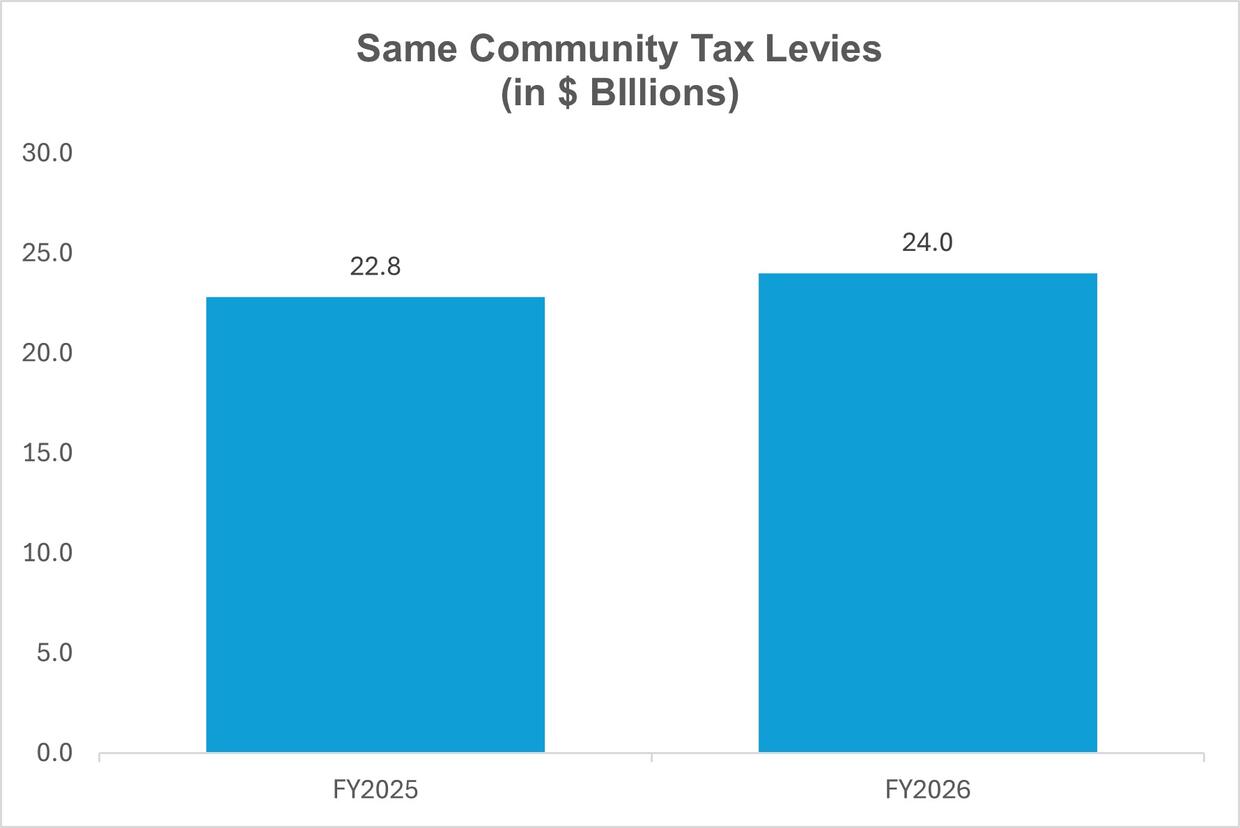
The tax levy increased in 337 communities and decreased in 6. The median percentage increase was 4.2%. The largest percentage increase was in Georgetown (26.5%) and largest decrease was in Hancock (-18.1%).
Assessed Values
The tax levy is distributed among taxpayers based on the assessed value (AV) of their properties as determined by the local assessors. Bureau of Local Assessment staff reviews and certifies the assessors’ estimates every five years to ensure that they comply with legal standards. Interim year adjustments to reflect changes in market conditions must also meet legal standards.
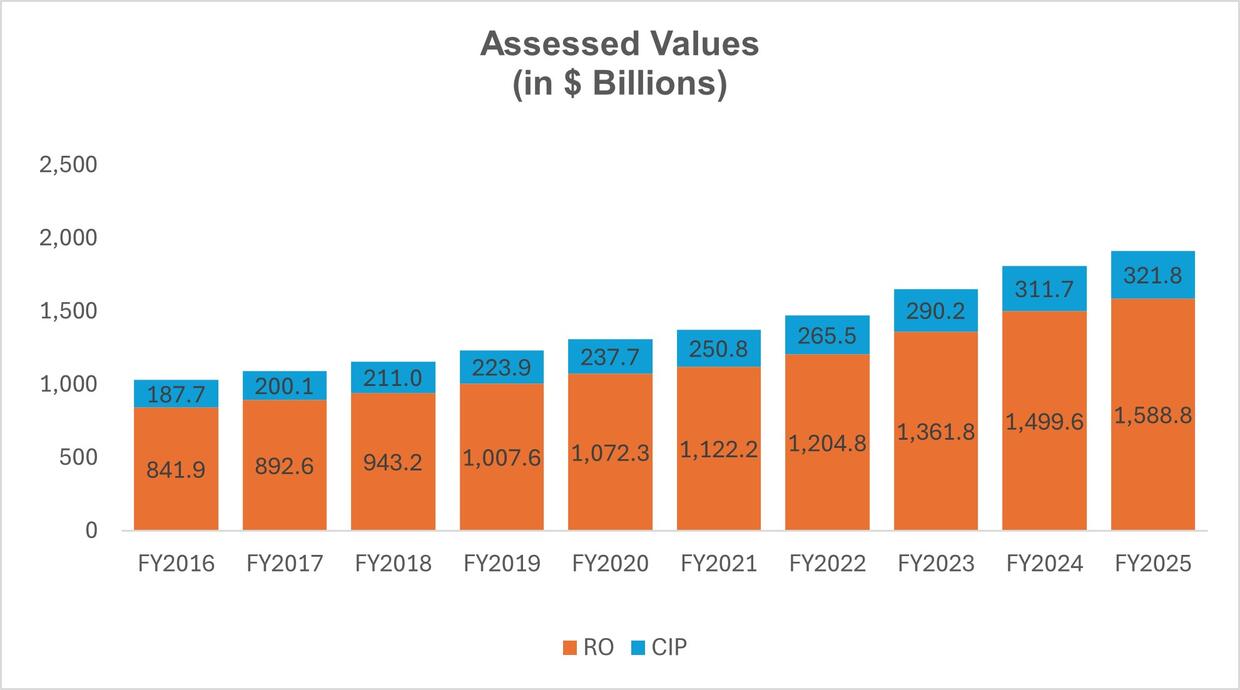
The next graph shows total AV from FY2016 to FY2025. Values rose by 85.6%, or $880.9 billion, from $1.030 trillion to $1.911 trillion. FY2016 was the first time AV first exceeded the $1 trillion mark.
Overall percentages of AV by the respective class groupings from FY2016 to FY2025 are seen in the following chart.
The next graph shows that in total for the 343 communities with tax rates approved for FY2026, AV increased from FY2025 to FY2026 by 4.9% ($93.8 billion) from $1.907 trillion to $2.001 trillion.
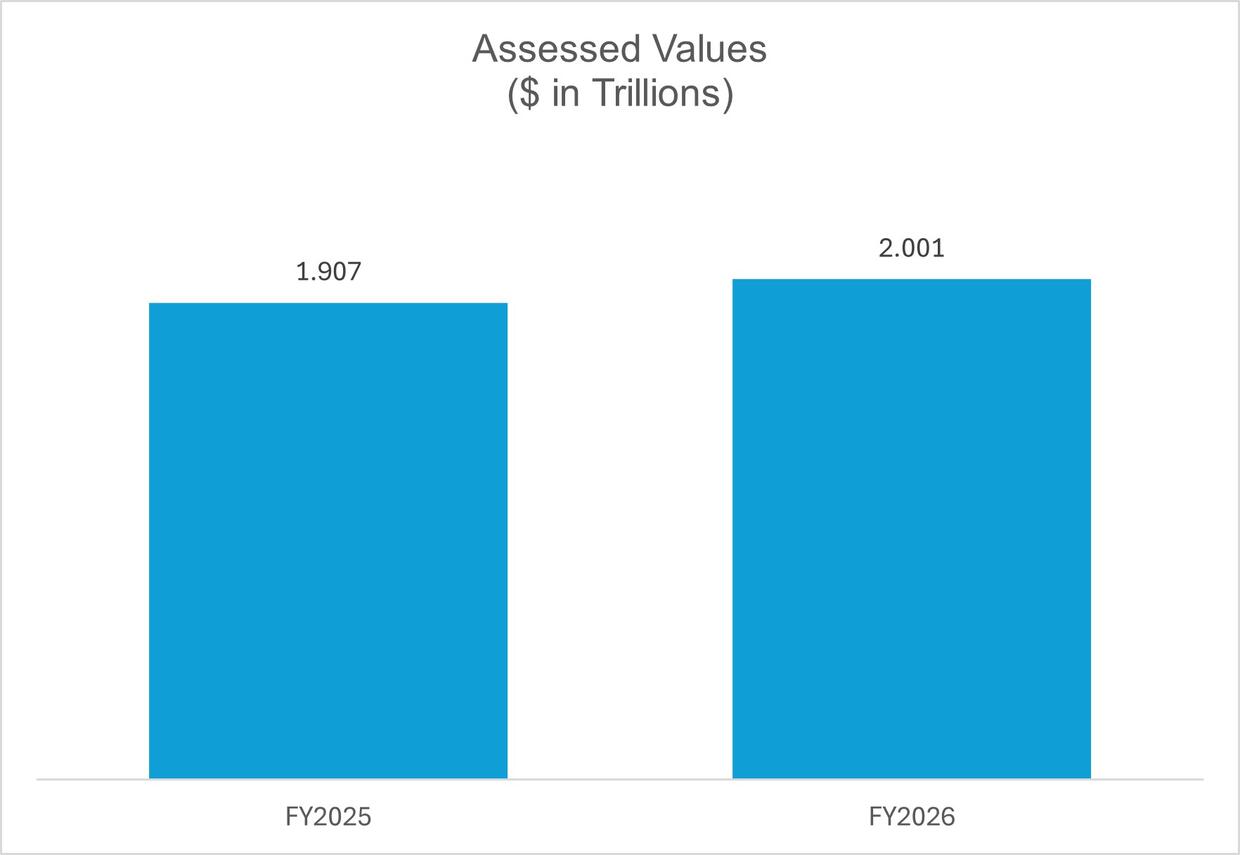
Assessed values increased in 340 communities and decreased in three and the median percentage for increases was 6%. The largest percentage increase was in Alford (29.7%) while the largest decrease was in Cambridge (4.1%).
Focusing on commercial values, the following graph displays commercial property assessed values from the time period before to the Great Recession to FY2026 for the 343 municipalities with tax rates set as of January 1, 2026.
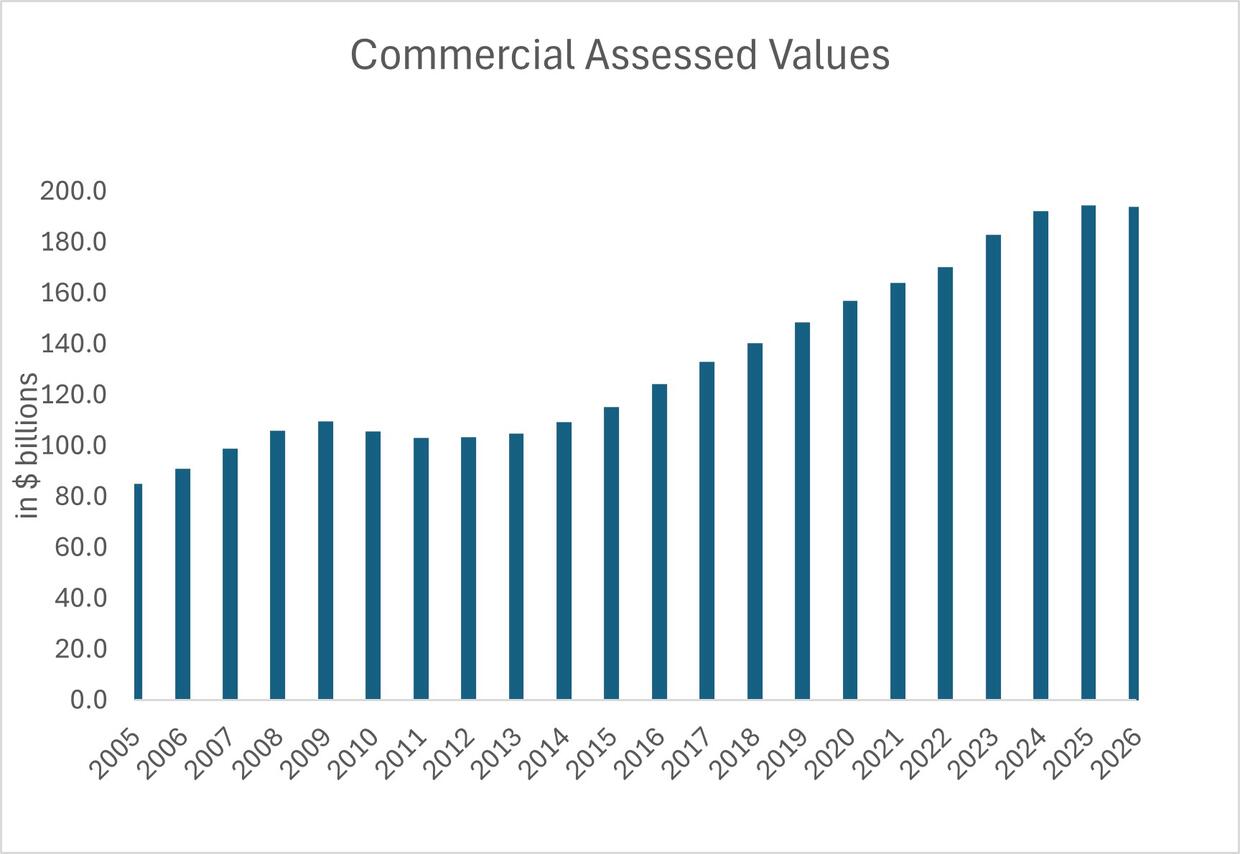
From FY2024 to FY2025, total Commercial assessed values rose by $2.5 billion, from $192.1 billion to $194.5 billion. Forty-eight communities realized a decrease in their values, 13 by less than $100,000, eight from $100,000 to $500,000, ten from $500,000 to $1,000,000 and 17 by greater than $1,000,000. The greatest decreases were in Boston ($1.8 billion) and Cambridge ($1.2 billion). The median decrease was $584,520 (1.4%).
From FY2025 to FY2026, total Commercial values fell by $703.7 million, from $194.5 billion to $193.7 billion. Forty-three communities realized a decrease in their values, eight by less than $100,000, eight from $100,000 to $500,000, three from $500,000 to $1,000,000 and 24 by greater than $1,000,000. The greatest decreases were again in Boston ($2.4 billion) and Cambridge ($2.2 billion). The median decrease was $1.6 million or 1.8%.
The Levy Limit
Proposition 2½ places limits on the amount of property taxes a community can levy. One limit is a tax levy ceiling which limits the property tax levy to 2.5% of the full and fair cash value of all taxable real and personal property in the community without specific further community action. Once the 2.5% level has been reached, the levy limit is said to have “hit the ceiling.”
A levy ceiling is one of two types of tax levy restrictions imposed by G.L. c. 59 § 21C (Proposition 2½). It states that in any year, the real and personal property taxes imposed may not exceed 2.5% of the total full and fair cash value of all taxable property. A levy limit is the other of the two types of tax levy restrictions imposed by G.L. c. 59 § 21C. It states that the real and personal property taxes imposed by a city or town may only grow each year by 2.5% of the prior year's levy limit, plus new growth and any overrides or exclusions. The levy limit can exceed the levy ceiling only if the community passes a debt exclusion, capital expenditure exclusion or special exclusion.
An incremental levy limit or tax levy that is within 90% to 99% of a levy ceiling can be referred to as “approaching the levy ceiling.” Of the 343 communities that have set an FY2026 tax rate as of the time of this writing, none had levy limits that were either at or had approached their levy ceilings.
Tax Shift
At the annual classification hearing, mayors, city/town councils and boards of selectmen decide how to further distribute the tax levy. These boards may decide within certain legal limits upon a single tax rate structure which distributes the tax levy in proportion to the share that their property class bears to the total assessed valuation of the community, or a multiple tax rate structure which shifts some of the taxes that would be paid by RO taxpayers under a single tax rate structure onto CIP taxpayers. These boards and councils may also decide to grant a residential exemption, an open space class discount and/or a small commercial exemption.
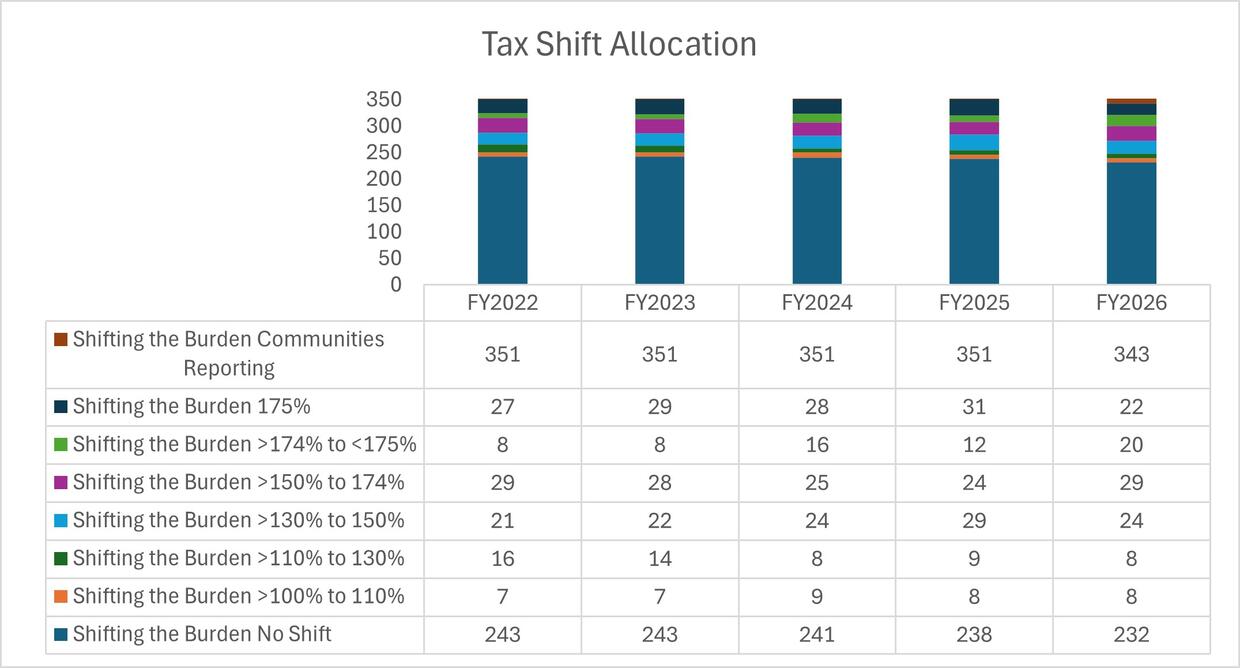
Most communities do not shift the tax burden from the residential and open space classes to the other classes of real and personal property. Generally, the communities that do so have done so for many years. The chart below shows complete data for FY2022 to FY2025 and for 343 FY2026 communities. For the eight tax rates yet to be certified, two (Florida and Monroe) shifted the burden in FY2025.
Tax Rates
The calculation of the annual tax rate involves the efforts of many local officials as well as the citizenry. Timely tax rate setting is an important key to a successful financial operation and helps avert a cash shortfall, temporary borrowing costs and work-flow disruption in city and town hall financial offices.
Across the Commonwealth, residential tax rates increased in 109 communities, decreased in 230 and four remained the same. The highest FY2026 residential tax rate is Westhampton ($20.35), while the lowest is Hancock ($2.18). The greatest dollar increase from FY2025 in a residential tax rate is Georgetown ($2.70), while the greatest dollar decrease from FY2025 is Williamsburg ($2.96). Commercial tax rates increased in 114 communities, decreased in 225 communities and remained the same in four. The highest FY2026 commercial tax rate is Holyoke ($38.15) and the lowest is Hancock ($2.18). The largest dollar increase from FY2025 in a commercial tax rate is Melrose ($2.86), while the largest dollar decrease is Holbrook ($3.06).
We hope that you found this article informative. A reminder that the data compiled for all the charts and graphs in this article can be found on the DLS website. Additional information, trainings and resources on this and a variety of other municipal finance subjects are also available.
Helpful Resources
City & Town is brought to you by:
Editor: Dan Bertrand
Editorial Board: Tracy Callahan, Sean Cronin, Janie Dretler, Jessica Ferry, Christopher Ketchen, Paula King, Jen McAllister, Brianna Ortiz and Tony Rassias
| Date published: | January 8, 2026 |
|---|