Author: Financial Management Resource Bureau
Municipal budgets are essential frameworks that determine how cities and towns allocate their resources to meet public needs. These budgets rely on four primary revenue sources: property taxes, state aid, local receipts and other available resources. Each source has distinct characteristics, limitations, and considerations, shaping the fiscal reality of municipalities. This article utilizes FY2024 data from the Division of Local Services’ (DLS) Revenue by Source report.
Property Taxes (58% of Revenue): Property taxes are the largest revenue source, accounting for 58% of municipal funding.[1] They are subject to the constraints of Proposition 2½, which limits the annual growth of property tax levies to 2.5%, plus new growth. While this ensures taxpayers are protected from steep increases, it also restricts the flexibility of municipalities in addressing rising costs.
State Aid (19% of Revenue): State aid is distributed through legislatively authorized programs, including:
- Local aid programs that provide general funding assistance (e.g., Chapter 70 Education Aid).
- Reimbursement programs for specific services or expenditures (e.g., property tax exemptions).
Though vital, state aid is subject to legislative appropriation and economic fluctuations, which can make it unpredictable in times of fiscal uncertainty.
Other Available Resources (14% of Revenue): This category includes:
- Community Preservation Act (CPA) funds, a local option property tax surcharge that must be used for open space, affordable housing, and historic preservation projects.
- Enterprise funds, which support services like water, sewer, or solid waste via user-based charges.
- Stabilization Funds and free cash, used for unexpected expenses, one-time outlays or, while not recommended, to balance budgets.
The strategic use of these resources provides municipalities with flexibility, particularly in maintaining financial stability during unforeseen challenges.
Local Receipts (9% of Revenue): These include:
- Local option excise taxes (e.g., meals, rooms, and cannabis).
- Motor vehicle excise (MVE)
- Fees, permits, fines, and investment income.
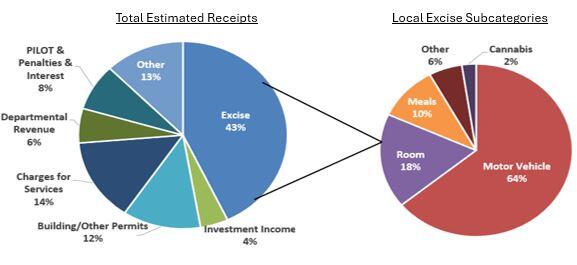
This revenue stream, while only 9% of total funding, is unique in its flexibility. Communities can adjust estimates annually based on economic trends. However, this also makes it the least predictable revenue source. Also, some of these revenue sources have formulas set in state law (e.g., MVE and local option taxes), meaning municipal officials cannot modify them. Others can be set at levels to fully cover the costs associated with the service being provided; therefore, it is recommended that municipalities annually review their fee structures.
In FY2024, 43% of estimated local receipts came from local excise taxes, highlighting their growing importance. Investment income and building permit fees also surged in recent years, reflecting high interest rates and strong economic activity.
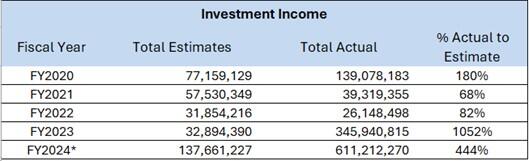
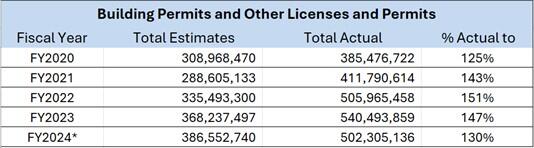
(FY2024 Total Actuals include data from municipalities that have submitted a tax rate recap for FY2025.)
Challenges in Estimating Local Receipts
Municipalities face the challenge of building budgets on fluctuating economic variables. Conservative budgeting practices are essential to avoid deficits. A widely adopted strategy is to project no more than 90% of the prior year’s actual receipts. Any excess revenue bolsters free cash reserves, while shortfalls reduce them
To further stabilize budgets, municipalities can use M.G.L. c. 40, § 5B, allowing the dedication of specific revenue streams (e.g., meals or rooms excise) to special-purpose stabilization funds. This approach creates financial buffers for capital improvements and other priorities, reducing reliance on volatile revenues.
Looking Ahead: Fiscal Planning Strategies
Policymakers should not only analyze historical trends but also account for potential economic vulnerabilities. Leveraging tools like the Trends in Local Receipts Report, which provides detailed community-level receipt data, and multi-year actual vs budget data can guide decision-making and improve transparency.
By balancing conservative revenue projections with proactive reserve-building strategies, municipalities can ensure fiscal resilience and adaptability in the face of economic uncertainties.
[1] When looking at General Fund revenues only, property taxes comprise of 63% of revenue.
Helpful Resources
City & Town is brought to you by:
Editor: Dan Bertrand
Editorial Board: Tracy Callahan, Sean Cronin, Janie Dretler, Emily Izzo, Christopher Ketchen, Paula King, Jen McAllister, Jessica Sizer and Tony Rassias
| Date published: | December 19, 2024 |
|---|