Industry trends
There are several challenges in understanding the full picture of the construction workforce. For conventional businesses with payroll employees covered by unemployment insurance, data on headcount and wages can be sourced from the Quarterly Census of Employment and Wages and the Bureau of Labor Statistics. However, a substantial share of the construction workforce is self-employed and therefore not included in QCEW or other statistics. Data on these workers is only available from the U.S. Census Bureau’s Nonemployer Statistics (NES) that leverages business income tax records from the Internal Revenue Service (IRS). Further complicating matters is the fact that some general contractors and other players in the construction industry misclassify construction laborers as self-employed or pay laborers in cash to lower their costs. Particularly among occupations without certifications or training requirements, undocumented immigrants are often participating. Thus, official estimates of the workforce may understate the actual size of the workforce and to the extent that these factors vary over time the relationship between the size of the workforce and the output of the workforce (housing units) may be inaccurate.
The construction industry contains four major subsectors: residential building, nonresidential building, heavy and civil engineering, and specialty trades. Residential and nonresidential building are sometimes grouped together under building construction and, as their names imply, deal with construction of homes versus commercial and industrial spaces. Firms are classified to industries based on primary activity, in the case of a mixed-use developer, if the majority of construction was focused on construction of housing, they would be classified as residential. The heavy and civil engineering industry is focused on large infrastructure projects such as roads or utilities. Specialty trades is a broad group of construction firms whose skills may be of use to the other construction industries, but not to any one specifically. Specialty trade contractors include businesses such as electricians, plumbers, and roofers. If a specialty trade is specific to a particular kind of construction they are classified in the industry that contains that form of construction, e.g. a firm which specializes in traffic signal installation would be classified under heavy and civil engineering.
In 2023, there were 172,544 employed workers in the Massachusetts overall construction industry, of which 36,000, or 21 percent worked in building construction. Employment in building construction was divided evenly between residential building construction and non-residential building construction, with each industry having approximately 18,000 jobs (see figure below). Since 2012, when Massachusetts and the nation were still recovering from the Great Recession and the foreclosure crisis, through 2023, the construction industry has grown from four to five percent of total employment across all industries. Residential building construction employment increased 43% over that time period, rising to 18,400 from 12,900. Over the same time, residential building construction has remained consistent as a share of the construction industry. In 2023, it made up approximately 11 percent of total construction employment and it remained at roughly this level for over 10 years.
Employment in the specialty trade contractors subsector, which includes a variety of skilled trades such as electricians and plumbers, is also essential to residential construction. Employment in this subsector makes up a much larger share of industry employment and can support construction activity of all types, not just building construction. This subsector has seen even more significant growth since 2012, rising from 79,400 in 2012 to 121,400 in 2023, an increase of over 53 percent.
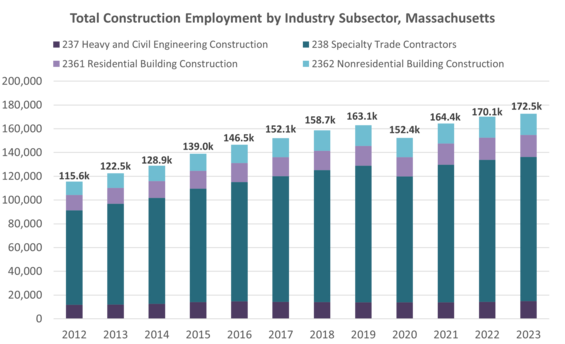
Source: U.S. Bureau of Labor Statistics QCEW Data via Lightcast
The statistics cited in the preceding paragraphs do not include self-employed workers, who are a major part of the residential construction industry. According to the Census nonemployer statistics for 2022, the latest year available, there were over 15,000 self-employed workers in the Massachusetts residential construction industry, compared to around 18,500 people working for employers in the residential construction industry that year. Thus, self-employed workers were approximately 45 percent of the industry in 2022. Since 2019, residential construction self-employment has grown 7 percent statewide, which is slower than employer residential construction jobs, and slower than the growth in residential construction non-employer in the U.S. overall, which was 10 percent.
Trends in core occupations
Historically, construction occupations have provided a path to the middle class and a high standard of living, especially for non-college educated male workers. In part, this is due to the high number of union jobs in the industry. According to the Bureau of Labor Statistics, 15.4 percent of employed individuals in the construction and extraction occupations nationwide are members of a union, well above the national average of 9.9 percent of all wage and salary workers in the U.S. A report from the Home Builder Institute indicates MA has highest median wages for production and nonsupervisory employees in the construction industry of 43 states that report data.
Nearly all of the “core occupations” (see chart below) in the construction industry have experienced substantial growth in jobs in recent years. Two out of the top five fastest growing core construction occupations in Massachusetts between 2012 and 2023 are first line supervisors (141% job growth) and construction managers (83% job growth). Other more traditional occupations have also experienced growth, including operating engineers and other construction equipment operators (96%), plumbers, pipefitters, and steamfitters (83%), electricians (56%), and cement masons and concrete finishers (54%).
Most, but not all, occupations have seen growth in their inflation-adjusted wages as well. Wage growth has been greatest for cement masons and concrete finishers, whose wages are up 35 percent after adjusting. All other occupations have seen wage growth at levels at or below 10 percent. Four occupations experienced declines in average wages.
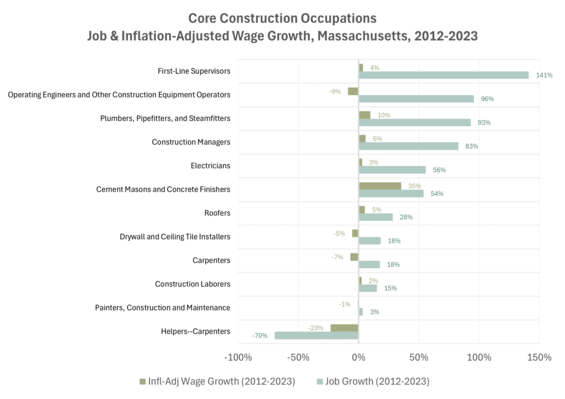
Source: U.S. Bureau of Labor Statistics Occupational Employment & Wage Statistics
Forecasted Labor Demand and Supply
According to data from the EOLWD, the construction of buildings industry, of which residential construction is a part, is projected to grow four percent between 2022 and 2032, compared to six percent for all industries. However, achieving the goals of this plan require increasing housing production rates by at least 15% when compared to the last decade. Without substantial increases in productivity, the projected industry growth will be insufficient to meet the demands.
Furthermore, there are demographic challenges facing the future construction workforce. In 2023, 30 percent of the Residential Building workforce was 55 years of age or older, meaning nearly one in three workers who build homes is nearing retirement age. Substantial numbers of new labor force entrants are needed just to maintain the current labor supply, much less increase it.
Another serious risk to the construction workforce is related to federal changes in immigration policy. The Construction Industry has a large share of employment that is non-citizen. In 2023, the ACS 1YR PUMS dataset shows that 21 percent of Massachusetts workers in construction occupations were not U.S. citizens. This varies by occupation, with more than half of hazmat workers, masons and roofers not having U.S. citizenship. In contrast, only 10 percent of the overall labor force is non-citizen in Massachusetts. Research about the Secure Communities program found that the large-scale deportation of undocumented immigrants led to overall declines in construction industry employment. Some, but not all, of the jobs left open by deported workers were filled by U.S. citizens, leading to an overall reduction in labor, a corresponding decline in the number of higher-skilled jobs in the construction industry, and a slowdown in home construction.
One potential avenue to help grow the construction industry could be through attracting workers who have historically been underrepresented in the industry. While women comprise 51 percent of all industry workers, only 21 percent of the Residential Construction industry is female and only 15 percent of Specialty Trade Contractors. There is significant room to increase the number of female workers in the industry. Similarly, only 18 percent of Construction Industry Employment is non-White compared to 30 percent of total industry employment.