Download Full Labor Market Information 101 PowerPoint
“Labor Market Information 101” is a resource designed to help our stakeholders better understand and access labor market information (LMI) materials from the Massachusetts Department of Economic Research (DER). It covers these topics and more:
- What DER is and who its stakeholders are
- What LMI is, why it is important, and how it can be used
- Key LMI definitions, concepts, and framework, including North American Industry Classification System (NAICS) and Standard Occupational Codes (SOC)
- An overview of the main types of data found on the DER website including units/source, available geography, links to download data, and more
- An appendix including common acronyms and links to additional resources
Download the PowerPoint below (tagged for ADA Compliance).
Additional Resources
-
Open PPTX file, 772.8 KB, LMI 101 2026 Version (English, PPTX 772.8 KB)
Labor Market Information (LMI) Basics
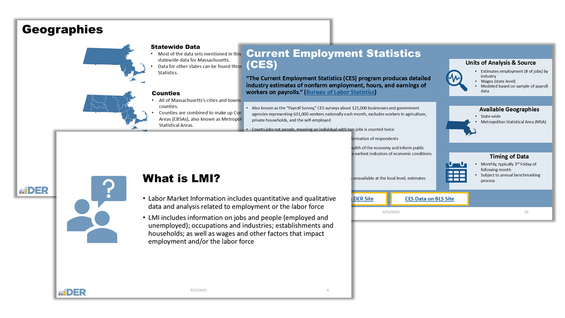
What is LMI?
Labor Market Information (LMI) includes quantitative and qualitative data and analysis related to employment or the labor force.
LMI includes information on jobs and people (employed and unemployed); occupations and industries; establishments and households; as well as wages and other factors that impact employment and/or the labor force.
Who uses LMI?
Labor Market Information is used by many groups including policymakers in state, local, and federal government; workforce development and training agencies; employers and businesses; jobseekers; students, educators, and academic institutions; researchers; and advocacy organizations.
Why is LMI important?
LMI encourages data-driven decision making for a wide range of stakeholders and is important for understanding local and regional economies, efficient resource allocation, understanding compensation and wages, guiding policy and strategy, and more.
Geographic Regions in Massachusetts
Use DER's Cities and Towns Tool to identify which cities/towns are in a particular geographic region and vice versa.
Statewide Data: Most data sets offered by DER include statewide data for Massachusetts. Data for other states can be found through the Bureau of Labor Statistics.
Counties: All of Massachusetts's cities and towns fall into one of 14 counties. Counties are combined to make up Core Based Statistical Areas (CBSAs), also known as Metropolitan and Micropolitan Statistical Areas.
Cities & Towns: Massachusetts has 351 cities and towns that make up counties. Cities and towns are also combined to make Workforce Development Areas (WDAs).
Workforce Development Areas (WDA) and Workforce Skills Cabinet (WSC) Regions
Every city and town in Massachusetts falls within one of 16 Workforce Development Areas, that then make up 7 Workforce Skills Cabinet Areas.
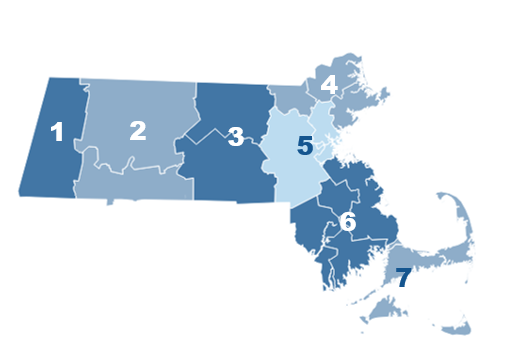
Map of Workforce Skills Cabinet Regions divided into Workforce Development Areas
| Workforce Skills Cabinet (WSC) Region | Workforce Development Areas (WDA) |
|---|---|
| 1. Berkshire Region | Berkshire WDA |
| 2. Pioneer Valley Region | Franklin/Hampshire and Hampden WDAs |
| 3. Central MA Region | North Central and Central WDAs |
| 4. Northeast Region | Greater Lowell, Lower Merrimack, and North Shore WDAs |
| 5. Greater Boston Region | Boston, Metro North, and Metro South/West WDAs |
| 6. Southeast Region | South Shore, Brockton, Bristol, and Greater New Bedford WDAs |
| 7. Cape Cod & Islands Region | Cape Cod & Islands WDA |
Metropolitan and Micropolitan Statistical Areas
Metropolitan and Micropolitan Statistical Areas (collectively referred to as Core Based Statistical Areas (CBSAs)) are geographic entities used by Federal statistical agencies in collecting, tabulating, and publishing federal statistics (US Census Bureau). They are county-based.
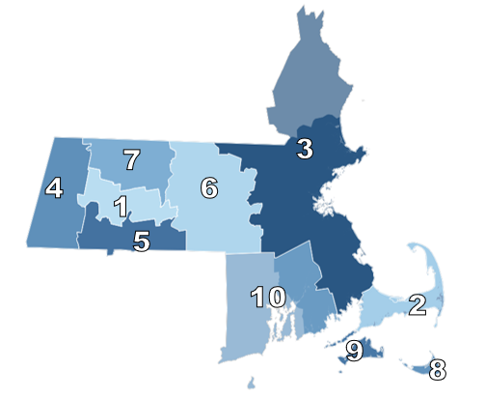
Map of Metropolitan and Micropolitan Statistical Areas (collectively referred to as Core Based Statistical Areas or CBSAs)
| Statistical Area | Included Counties |
|---|---|
| 1. Amherst Town-Northampton, MA Metropolitan | Hampshire County, MA |
| 2. Barnstable Town, MA Metropolitan | Barnstable County, MA |
| 3. Boston-Cambridge-Newton (MA-NH) Metropolitan* | Essex County, MA; Middlesex County, MA; Norfolk County, MA; Plymouth County, MA; Suffolk County, MA plus Rockingham County, NH; Strafford County, NH |
| 4. Pittsfield, MA Metropolitan | Berkshire County, MA |
| 5. Springfield, MA Metropolitan | Hampden County, MA |
| 6. Worcester, MA Metropolitan | Worcester County, MA |
| 7. Greenfield, MA Micropolitan | Franklin County, MA |
| 8. Nantucket, MA Micropolitan | Nantucket County, MA |
| 9. Vineyard Haven, MA Micropolitan | Dukes County, MA |
| 10. Providence-Warwick (RI-MA) Metropolitan** | Bristol County, MA plus Bristol County, RI; Kent County, RI; Newport County, RI; Providence County, RI; Washington County, RI |
*LAUS, CES, and OEWS estimates published on the DER website for Boston-Cambridge-Newton (MA-NH) Metropolitan Statistical Area include the New Hampshire counties listed above. QCEW estimates published on the DER website include only the MA counties. Data for full MSAs is available through BLS. **LAUS, OEWS, and QCEW estimates published on the DER website for Providence-Warwick (RI-MA) Metropolitan Statistical Area include only Bristol County, MA. DER does not publish CES estimates for Providence-Warwick (RI-MA) Metropolitan Statistical Area. Data for full MSAs is available through BLS. | |
Occupations and Standard Occupational Classification (SOC)
"The 2018 Standard Occupational Classification (SOC) system is a federal statistical standard used by federal agencies to classify workers into occupational categories for the purpose of collecting, calculating, or disseminating data. All workers are classified into one of 867 detailed occupations according to their occupational definition." (Bureau of Labor Statistics)
| SOC Example: Surgical Technicians | ||
|---|---|---|
| Digits/Code | Level of Detail | Title |
| 29-0000 | Major Groups | Healthcare Practitioners and Technical Occupations |
| 29-2000 | Minor Groups | Health Technologists and Technicians |
| 29-2050 | Broad Occupations | Health Practitioner Support Technologists and Technicians |
| 29-2055 | Detailed Occupation | Surgical Technicians |
Additional Resources
Industries and the North American Industry Classification System (NAICS)
“The North American Industry Classification System (NAICS) is the standard used by federal statistical agencies in classifying business establishments for the purpose of collecting, analyzing, and publishing statistical data related to the U.S. business economy." (US Census Bureau). A firm may have multiple establishments with multiple NAICS codes - for example, a firm that has a warehouse and a retail location.
| NAICS Example: Other Outpatient Care Centers | ||
|---|---|---|
| Digits/Code | Level of Detail | Description |
| 620000 | Economic Sector | Healthcare and Social Assistance |
| 621000 | Subsector | Ambulatory Health Care Services |
| 621400 | Industry Group | Outpatient Care Centers |
| 621490 | NAICS Industry | Other Outpatient Care Centers |
Additional Resources
Current Employment Statistics (CES) Data
“The Current Employment Statistics (CES) program produces detailed industry estimates of nonfarm employment, hours, and earnings of workers on payrolls.” (Bureau of Labor Statistics)
| Current Employment Statistics (CES) At-A-Glance | |
|---|---|
| Units of Analysis & Source | Estimates employment (# of jobs) by industry; Wages (state level). Modeled based on sample of payroll data |
| Available Geographies | State-wide; Metropolitan Statistical Areas (MSA) |
| Timing of Data | Monthly release, typically 3rd Friday of the following month. Subject to annual benchmarking process. |
Additional Details
- Also known as the “Payroll Survey,” CES surveys about 121,000 businesses and government agencies representing 631,000 workers nationally each month, excludes workers in agriculture, private households, and the self-employed
- Counts jobs not people, meaning an individual with two jobs is counted twice
- Data is published in a way that protects identifiable information of respondents
- How is this data used? Can be used to gauge overall health of the economy and inform public policy, economic research and planning, etc. One of the earliest indicators of economic conditions each month
- PROS: Recent data available; time series | CONS: Smaller sample size; seasonally adjusted data is unavailable at the local level
Additional Resources
Local Area Unemployment Statistics (LAUS) Data
“The Local Area Unemployment Statistics (LAUS) Program Produces monthly and annual employment, unemployment, and labor force data…” (Bureau of Labor Statistics)
| Local Area Unemployment Statistics (LAUS) At-A-Glance | |
|---|---|
| Units of Analysis and Source | Estimates number of people employed, unemployed, and in the labor force. Models use data from CPS, CES, UI Systems, and ACS depending on geography |
| Available Geographies | State-wide, Workforce Development Area (WDA), City/Town, County, Metropolitan Statistical Areas (MSA), Micropolitan Statistical Areas |
| Timing of Data | Monthly, typically 3rd Friday of the following month for state data and the following Tuesday for substate data |
Additional Details
- LAUS estimates for various geographies take different inputs into account including the Current Population Survey (CPS), Current Employment Statistics (CES), local unemployment insurance systems, and the American Community Survey (ACS)
- How is this data used? Estimates are considered key indicators of local economic conditions, used by federal program eligibility determinations and resource allocations; planning and budget in local/state government; and assessing and comparing labor market development and status by private industry/ researchers/ media /etc
- PROS: Recent data available; time series | CONS: Smaller sample size; seasonally adjusted data is unavailable at the local level
LAUS Definitions
The labor force is made up of employed people and unemployed people.
Unemployed people include anyone not currently employed but actively seeking and available for work, regardless of whether they are receiving unemployment insurance benefits. Includes people entering and re-entering the labor force.
The Labor Force Participation Rate (LFPR) is calculated by dividing the number of people in the labor force by the total working age population (civilian, non-institutionalized population 16+).
The Unemployment Rate is calculated by dividing the number of unemployed people by the total labor force.
Additional Resources
Occupational Employment and Wage Statistics (OEWS) Data
“The Occupational Employment and Wage Statistics (OEWS) program produces employment and wage estimates annually for nearly 830 occupations.” (Bureau of Labor Statistics)
| Occupational Employment and Wage Statistics (OEWS) At-A-Glance | |
|---|---|
| Units of Analysis and Source | Estimates employment (number of jobs) and wages for occupations. Source is survey collection of UI covered establishments over several survey panels |
| Available Geographies | State-wide, County, Metropolitan Statistical Areas (MSA), Micropolitan Statistical Areas |
| Timing of Data | Annual publication of data (usually April). Two panels of survey collection (May and November). |
Additional Details
- Occupational and wage data is requested for approximately 21,000 Massachusetts establishments over a three-year period. Sampling is based on the employer's state unemployment insurance tax account including local governments and non-profit organizations. Does NOT include gig workers, military, private households, religious establishments, and most employees that are full time students
- Participation is not currently mandatory in Massachusetts
- Data is published in a way that protects identifiable information of respondents
- How is this data used? OEWS data can be used to compare employment and wages across geographic areas, for different occupations, and for occupations across industries. It can be used to determine which jobs pay a living wage in a specific area
- PROS: Important source of wage data; large sample size; lower error ranges | CONS: Publication lag; not a time series
Additional Resources
Quarterly Census of Employment and Wages (QCEW) Data
“The Quarterly Census of Employment and Wages (QCEW) program publishes a quarterly count of employment and wages reported by employers covering more than 95% of U.S. jobs at the county, state, and national levels by industry.” (Bureau of Labor Statistics).
| Quarterly Census of Employment and Wages (QCEW) At-A-Glance | |
|---|---|
| Units of Analysis and Source | Estimates employment (number of jobs), wages, and number of establishments by industry. Census of all establishments subject to Unemployment Insurance tax in Massachusetts |
| Available Geographies | State-wide, Workforce Development Area (WDA), City/Town, County, Metropolitan Statistical Areas (MSA), Micropolitan Statistical Areas |
| Timing of Data | Quarterly data published within 6 months after the end of referenced quarter, annual reports released about 8 months after the end of referenced year |
Additional Details
- Excludes unincorporated self-employed, certain farm and domestic workers, proprietors, and railroad workers covered by the railroad UI program as well as members of the armed forces, federal, state, and local elected officials
- Data is published in a way that protects identifiable information of respondents
- How is this data used? QCEW data are widely used by federal statistical agencies, BLS surveys, and other public and private establishments as a basis for their statistics and research publications (BLS). It can help data users understand what industries are most prominent in different areas
- PROS: High quality and quantity of data; consistent history; used to benchmark | CONS: Publication lag; not designed to be used for time series analysis
Additional Resources
Frequently Asked Questions on LMI Data
How is the labor force calculated and who is included?
- The labor force is calculated by adding the number of employed people to the number of unemployed people in a specific geography. All people counted in the labor force are civilian, non-institutionalized, and 16 or older.
- The labor force only includes those seeking and available for work. It does not include retired people, family caregivers, and others who are not seeking and/or unavailable for work.
- The Labor Force Participation Rate is calculated by dividing the labor force by the total working age population (civilian, non-institutionalized, and 16 or older).
How is the unemployment rate calculated and who is considered unemployed?
- The unemployment rate is calculated by dividing the number of unemployed people by the labor force.
- Unemployed people in this case includes anyone not currently employed but actively seeking and available for work, regardless of whether they are receiving unemployment insurance benefits.
- This includes people entering the labor force for the first time and re-entering the labor force.
What is benchmarking?
- At the start of each year, Current Employment Statistics (CES) and Local Area Unemployment Statistics (LAUS) data series go through a benchmarking process. Benchmarking takes into consideration data inputs, historical updates, late tax filings, and other figures that call for revision (Bureau of Labor Statistics). Visit the BLS Website for more information about benchmarking.
- Current Employment Statistics (CES) publishes preliminary and revised estimates each month and revised annual estimates at the beginning of each year. Visit the BLS website for more information about CES benchmarking.
- Local Area Unemployment Statistics (LAUS) publishes annual revisions at the beginning of each year. Visit the BLS Website for more information about LAUS benchmarking.
What is seasonal adjustment?
- "Seasonal adjustment is a statistical technique that attempts to measure and remove the influences of predictable seasonal patterns to reveal how employment and unemployment change from month to month..." (Bureau of Labor Statistics)
- Labor force, employment, and other measures of labor market activity can be affected by changes in weather, holidays, harvests, school schedules, etc.
- Since seasonal events follow trends, they can be accounted for using seasonal adjustment, making it easier to observe cycles and underlying trends in the series.
- When trying to observe cycles and underlying trends, use seasonally adjust data.
- When trying to observe seasonal cycles and trends, use non-seasonally adjusted data.
If you have additional questions not answered here, please see DER's Frequently Asked Questions page for more information.