Precipitation Observation Stations
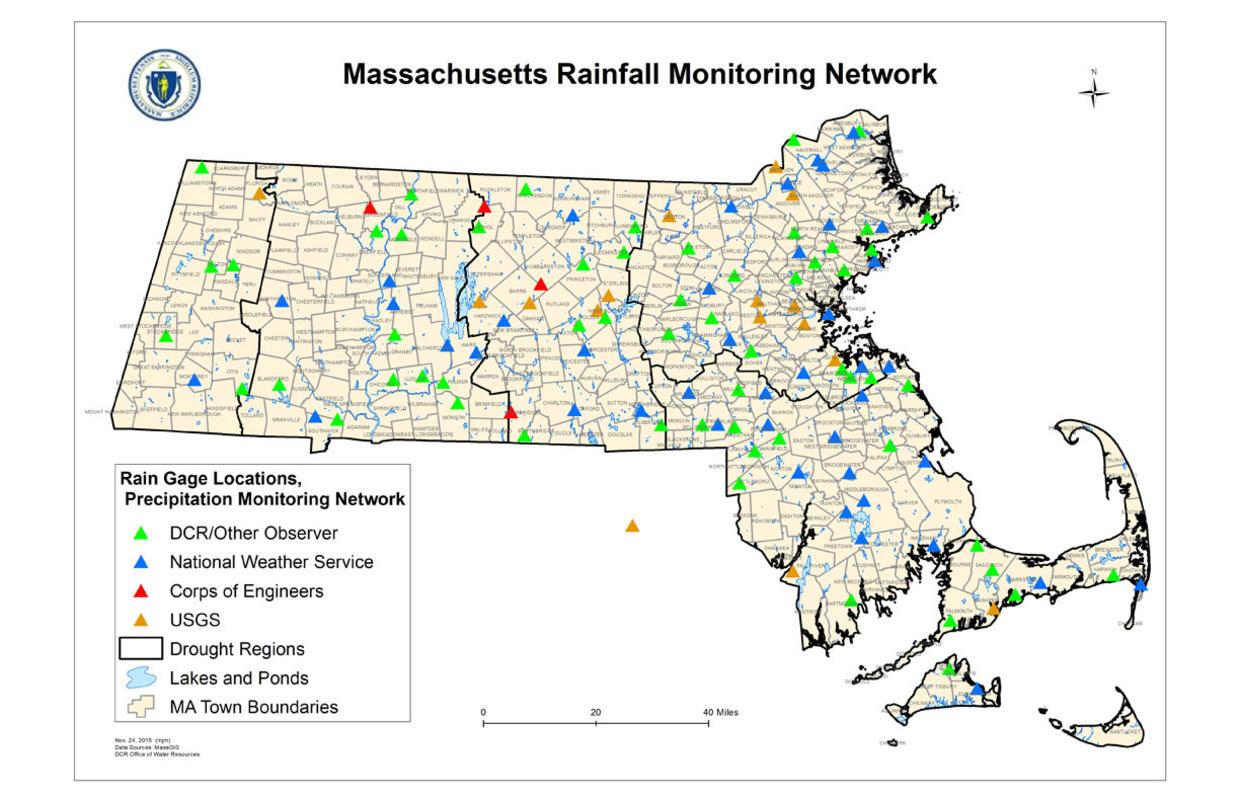
DCR operates a network of approximately 60 precipitation observation stations throughout Massachusetts. These help the department accurately keep track of precipitation levels around the state. You can use the map below to view where these stations are located, and you can use the attached document to find out more details about each station.
The WRC collects data from the National Weather Service’s online tool, NOWData. There is also a specific set of data available for Berkshire County.
Additional Resources
-
Open XLS file, 56.5 KB, Rain Gage Locations (English, XLS 56.5 KB)
-
Open JPG file, 209.6 KB, Map of Precipitation Monitoring Stations (English, JPG 209.6 KB)
Precipitation Database
DCR's Office of Water Resources maintains a precipitation database that incorporates information from observers across the state and cooperative agencies. Precipitation values in the database are totals for each station for each month. Snow and ice are melted and reported as inches of water.
Data from the precipitation database are currently available to the public in Microsoft Excel format. Data is sorted alphabetically by station and then listed by year. Note: The unit used for precipitation data is inches.
If you have any questions, please contact:
climate.data@state.ma.us
Additional Resources
-
Open XLS file, 3.88 MB, Precipitation Database Data 2019 (English, XLS 3.88 MB)
Average Precipitation Statistics
DCR precipitation data are used to calculate average precipitation statistics in the seven Drought Regions of the state. If you would like to access data prior to those dates available below, please email climate.data@state.ma.us.
Standardized Precipitation Index (SPI)
The Standardized Precipitation Index (SPI) is one of seven indices used by the Massachusetts Drought Management Task Force to determine the level of drought severity. The SPI reflects precipitation conditions. SPI values are calculated monthly using data from the precipitation database. These values reflect “look-back” periods of three months, six months, and twelve months.
The SPI values for these time periods are equivalent to the number of standard deviations from normal precipitation totals for that time period. This can be understood as:
- The further a positive number is from 0, the higher precipitation is from normal
- The further a negative number is from 0, the lower precipitation is from normal
If you would like to access data prior to those dates available below, please email climate.data@state.ma.us
| 2020 SPI Values | 2019 SPI Values |
|---|---|
| 2018 SPI Values | 2017 SPI Values |