Author: Paula King, BLA Field Advisor
In a recent edition of City & Town, we introduced the fundamentals of New Growth. For reference, New Growth data is available on the DLS website. In this article we’ll build upon our understanding of New Growth to analyze data trends and geographic impacts of New Growth across the Commonwealth.
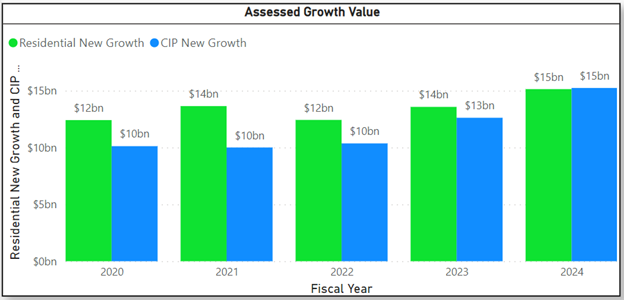
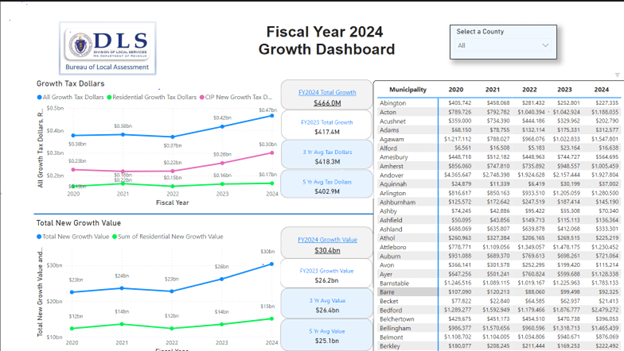
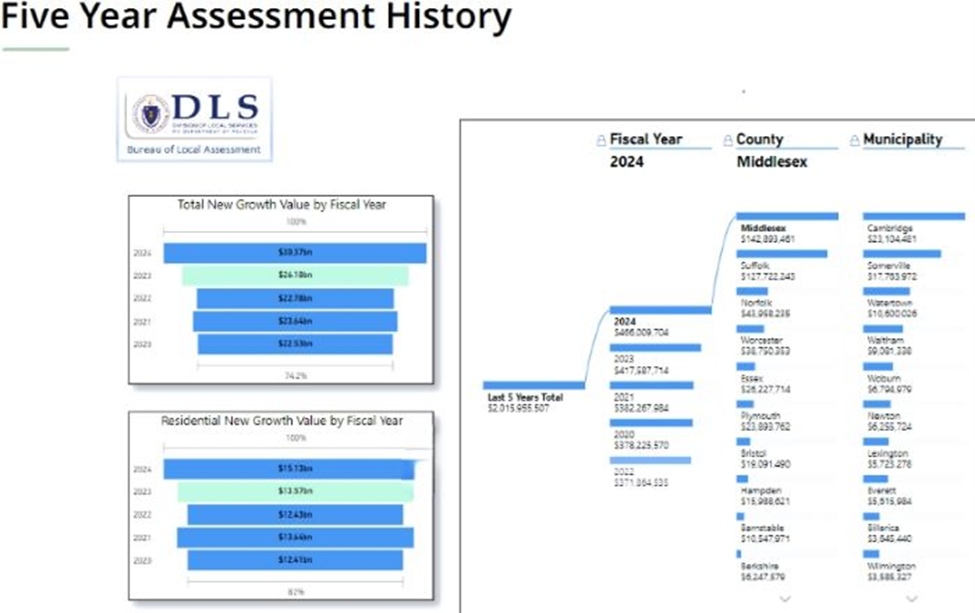
In FY24, the total New Growth value was $30.4 billion with $15.1 billion coming from the Residential and Open Space (R&O) class and the $15.3 billion from the combined Commercial, Industrial and Personal Property (CIP) sector. The $30.4 billion is approximately 21% higher than the five-year average of $25.1 billion.
In FY24, total New Growth tax dollars was $466 million, with the R&O class making up $165.2 million, or 35.46%, and the CIP class contributing $300.7 million, or 64.54%. The reason there is a different percentage in the tax dollar is due to the communities that adopted a split tax rate. In FY24 there were 112 communities that adopted a residential factor of less than “1”, which reduces the share of the tax levy paid by the RO classes and increases the share paid by the CIP classes. The result is two tax rates: one for RO properties and a second, higher rate for CIP properties.
FY24 New Growth is concentrated in the Middlesex and Suffolk counties. These two counties represent 58% of the $466 million, consisting of over $270 million in New Growth tax dollars. Visit the Bureau of Local Assessment data visualization to view more data.
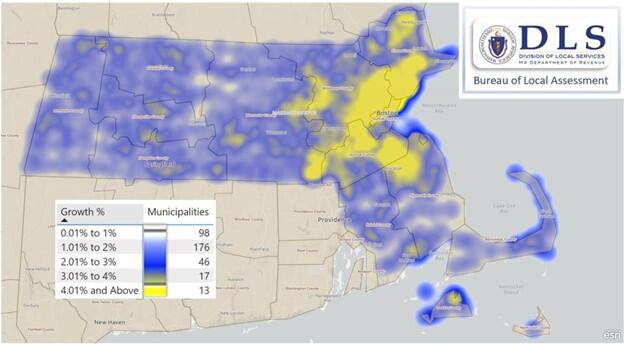
The following heat map shows the total New Growth applied to the Levy Limit as a percentage of the municipalities’ prior year's Levy Limit. In it we see that half of the 351 cities and towns had New Growth equal to between 1% - 2% of the levy limit. Nearly 80% of all municipalities had New Growth equal to less than 2%.
Understanding New Growth and the critical role it plays in the fiscal well-being of a municipality is an important tool to unlock a broader appreciation for the interconnectivity of local finance in Massachusetts. Because New Growth expands the levy limit, it is also a key part of the budget process. Municipal finance teams, local policymakers and elected officials should work collaboratively to develop policies and practices that leverage this important data in the decision-making process. To view additional information related to New Growth, please see the DLS Municipal Trend Dashboard - New Growth Analysis webpage.
We hope you find this information useful. If there is a topic or area of assessing, you’d like to see featured in the future, please email us at bladata@dor.state.ma.us.
Helpful Resources
City & Town is brought to you by:
Editor: Dan Bertrand
Editorial Board: Marcia Bohinc, Linda Bradley, Sean Cronin, Emily Izzo and Tony Rassias
| Date published: | June 6, 2024 |
|---|


