Author: Paula King, BLA Field Advisor
The following article will explain what New Growth is, why it plays a critical role in the financial wellbeing of a municipality, and how you can utilize New Growth data for every community in Massachusetts. This information will help you understand where your growth is coming from and point to resources that will allow you to review trends from similar communities that can assist in predicting future growth.
Proposition 2½ provides a city or town with annual increases in their levy limits of 2.5 percent and an additional amount based on the valuation of certain new construction and other allowable growth in the tax base that is not the result of property revaluation. This is commonly referred to as New Growth. These annual increases are allowed so long as they do not result in a levy limit above the levy ceiling of 2.5 percent of full and fair cash valuation. If that occurs, the levy limit equals the levy ceiling. General Laws Chapter 59, Sections 21C(b) and (f). The Commissioner of Revenue is required to determine the annual levy limit for each city and town. For the Commissioner to do so, cities and towns must submit information documenting allowable tax base growth prior to setting the tax rate. The Commissioner cannot approve a tax rate for any city or town that does not submit a report on its allowable tax base growth for that fiscal year. G.L. c. 59, § 21D. The purpose of this provision is to recognize that new development results in additional municipal costs; for instance, the construction of a new housing development may result in increased school enrollment, public safety costs, and so on.
What qualifies as New Growth?
Tax base growth under Proposition 2½ includes any parcel of real property or article of personal property that is:
- subject to taxation for the first time (e.g., new construction, new articles of personal property or previously exempt property)
- taxed as a separate parcel for the first time (e.g., subdivisions or condominium conversions)
What does not qualify as New Growth:
- The allowable value does not include any increases attributable to changes in the market value of properties in the community, nor is it reduced or offset by decreases in the community’s total assessed valuation due to property changes occurring each year.
- The allowable value does not include the implementation of new valuation systems which is the conversion of a CAMA system which may lead to higher values. Also not included is the annual updating of the cost tables which may result in higher values.
To learn more about the fundamental components of New Growth, please see our Municipal Finance Training and Resource page.
New Growth Data and Trend Analysis
DLS maintains New Growth data for all communities within the Commonwealth. The data can be viewed in customizable search reports. The first report generally displays statewide metrics while the second report provides information by municipality.
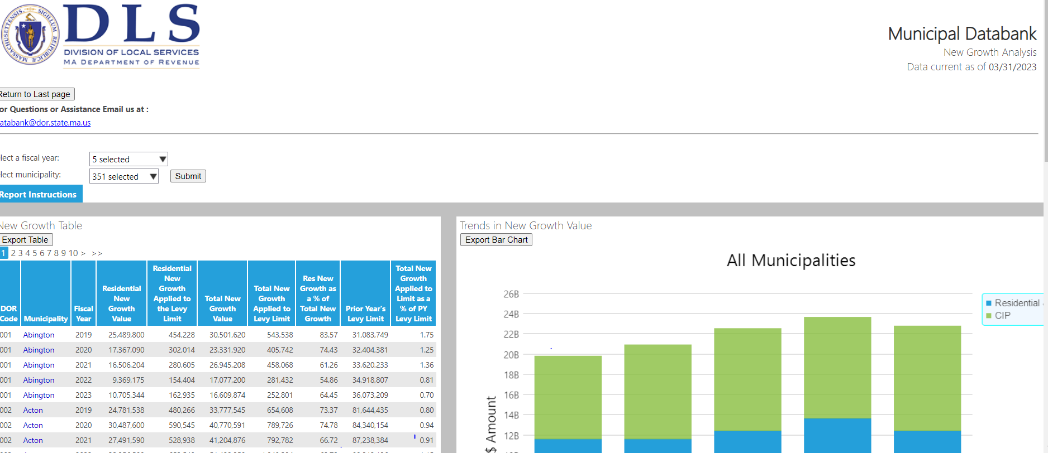
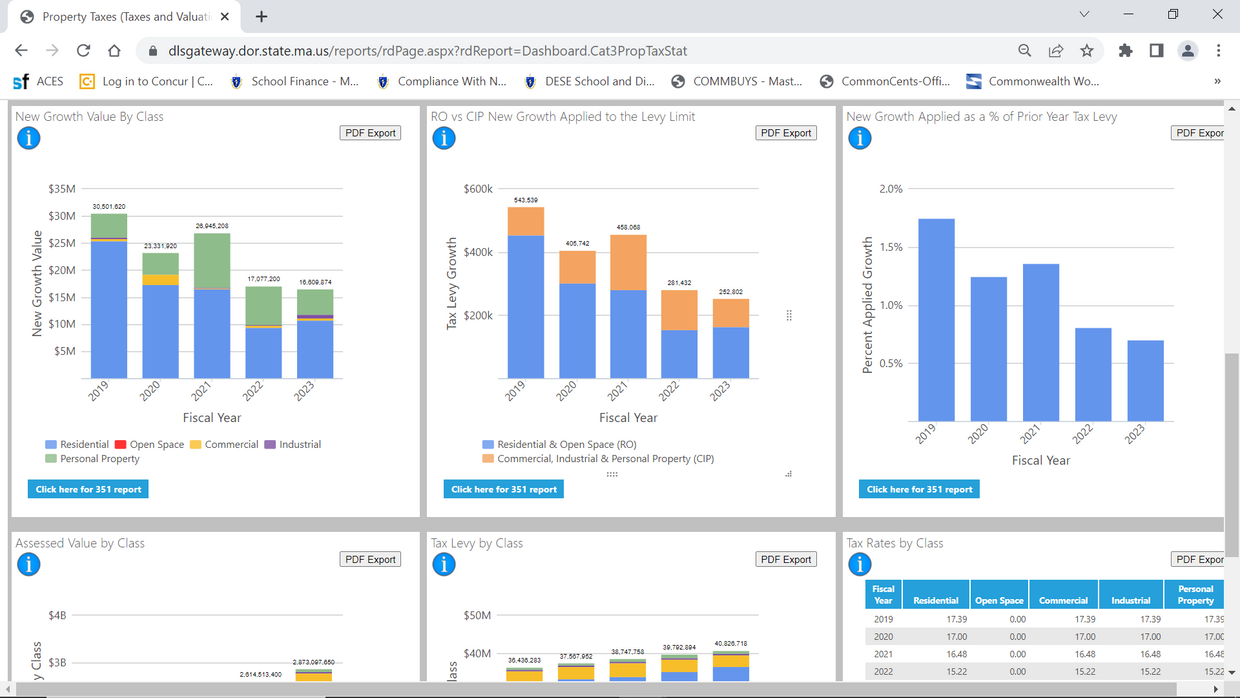
These data points and metrics can be compared with like communities or across the entire range of the Commonwealth’s 351 cities and towns. With all this valuable information literally available at your fingertips, you can research trends for assessing purposes or for financial planning.
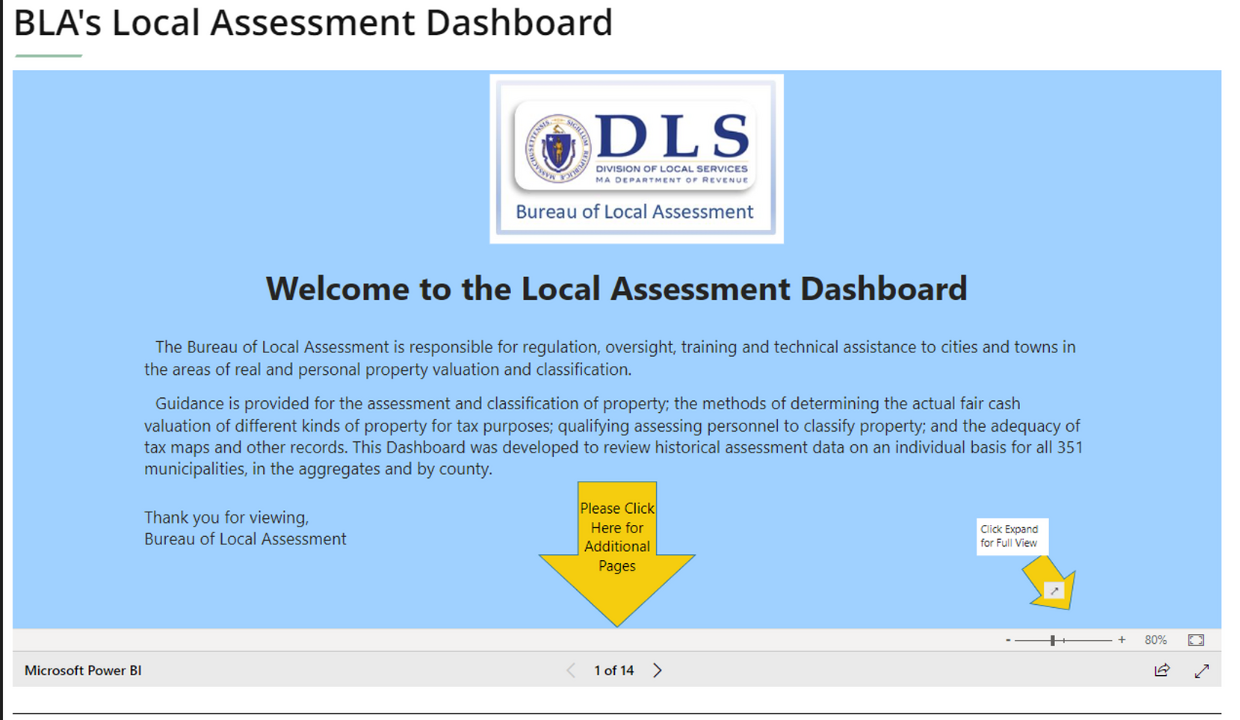
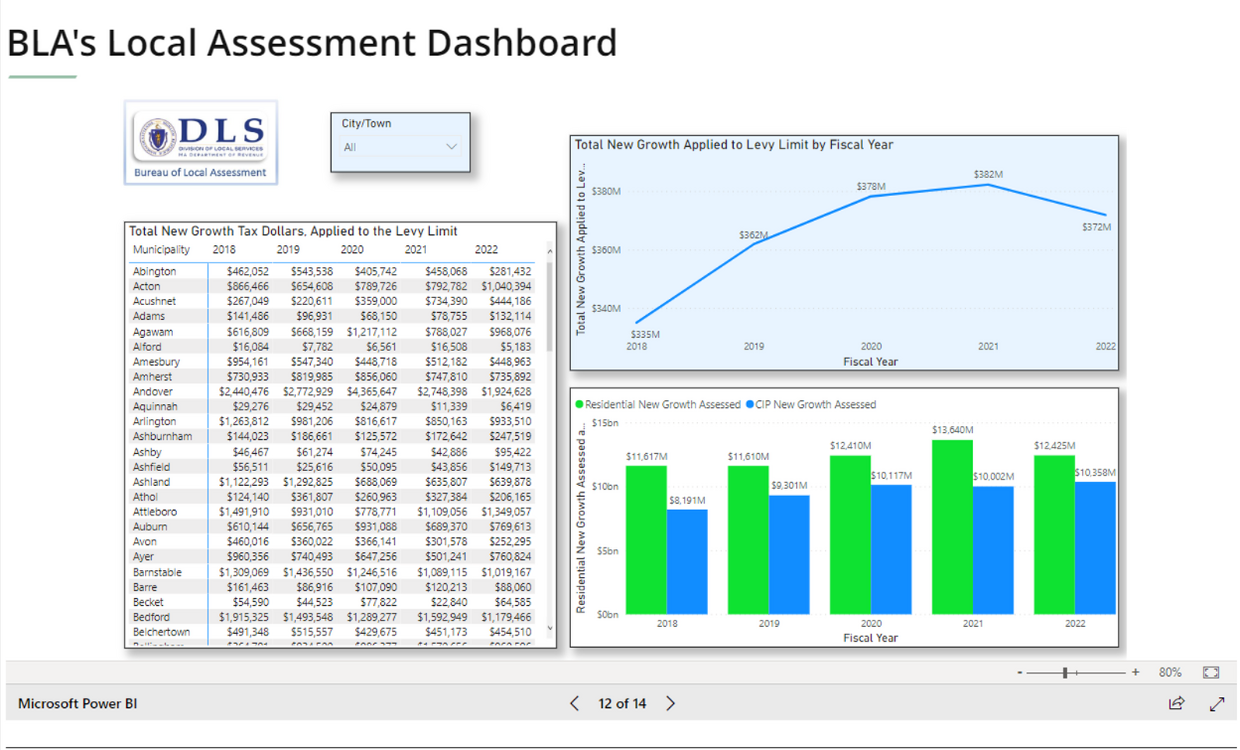
BLA’s Assessment Data Dashboards allow you to visualize your community’s New Growth Numbers for the past five years several different ways. As shown below, you can go to page 12 of the BLA Local Assessment Dashboard to view the New Growth as it pertains to the Levy Limit as well as the distribution of assessed value in new growth between the Residential and Commercial, Industrial and Personal Property (CIP). You can customize your search, selecting a single community up to all 351 communities.

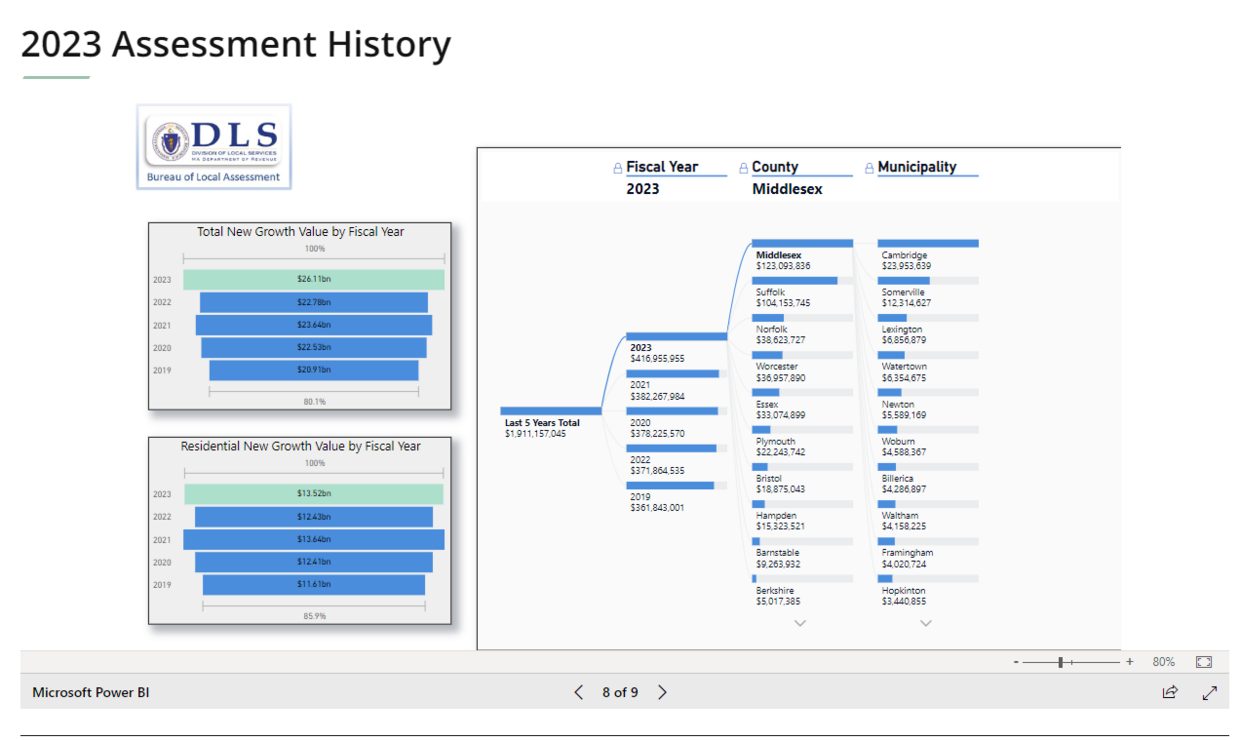
The 2023 Assessment History dashboard, as shown in the first screenshot below, enables you to view New Growth as it pertains to value from a county or municipality standpoint over a 5-year period. Page 8 of the same dashboard provides information specifically for FY23. Growth is a very important component of municipal finance in Massachusetts. With this information, public officials can view approved growth numbers from the current year and from the previous four years for their community and other peer communities. This growth visualization page also has total growth value and residential New Growth value by fiscal year.
Accurately collecting New Growth ensures the tax burden is evenly and fairly distributed on all taxable real & personal property. With the New Growth number established, the municipality then knows exactly how much of the budget can be funded by property tax. To consistently capture as much new growth and maintain accurate data, the BLA requires that a periodic data inspection program provide for the inspection of each parcel at least once every ten years. It is highly recommended that this be an ongoing program to ensure current accurate data be used in the valuation process and to spread out the data collection cost. Assessors annually inspect building permits, conduct abatement inspection and verify sales information to collect growth, but these cyclical inspections often produce growth from unpermitted work or items missed from prior listings.
We hope you find our local assessment trend visualization tools, reports relating to property tax data, and our DLS YouTube videos useful in analyzing new growth for your community. These tools are not only informative, but a valuable resource when presenting critical information to all stakeholders including City Council and Select Board members, Finance Committees and taxpayers.
We welcome any suggestions for future local assessment projects. If you would like to provide any feedback, please email us at bladata@dor.state.ma.us.
Helpful Resources
City & Town is brought to you by:
Editor: Dan Bertrand
Editorial Board: Marcia Bohinc, Linda Bradley, Sean Cronin, Emily Izzo and Tony Rassias
| Date published: | July 6, 2023 |
|---|