Introduction
The Executive Office of Labor and Workforce Development presents this workforce report and data dashboard in partnership with the Boston Women’s Workforce Council and members of Boston University’s Faculty of Computing & Data Sciences, Department of Computer Science, and Department of Sociology.
This data has been collected from reports submitted by Massachusetts employers under the Frances Perkins Workplace Equity Act of 2024. For more details on data collection and reporting standards, please see Workforce Data Reporting FAQs.
This webpage includes several ways to access data and insights on the Massachusetts workforce:
- Access Key Learnings or download the full, ADA-compliant PDF report
- Explore the data using an interactive dashboard, including by NAICS industry, by job category, and by county
- Download the anonymized, aggregated data
Key Learnings & Full Report Download
Download the full report
-
Open PDF file, 2.02 MB, 2025 Workforce Data Report (English, PDF 2.02 MB)
Key Learnings
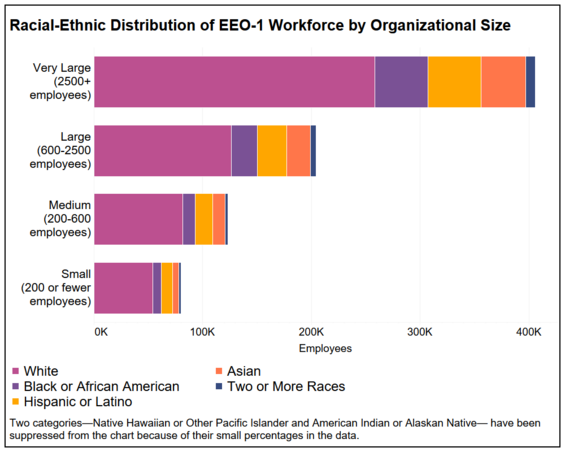
- Greater Diversity in the Largest Employers: Companies with 2,500 or more employees demonstrate higher levels of racial and gender diversity—possibly due to more robust HR infrastructure and diversity strategies. See "Racial-Ethnic Distribution of EEO-1 Workforce by Organizational Size."
- Gender Balance in Private Sector: Women make up 54% of the workforce in reporting private-sector companies, with higher representation in healthcare, education, and administrative support roles.
- Persistent Occupational Disparities: Black and Hispanic workers remain overrepresented in lower-wage roles, such as service work, laborers, and administrative, and underrepresented in executive and managerial positions. Senior executive roles remain disproportionately held by white men.
- Gender Gaps in Male-Dominated Industries: Women remain significantly underrepresented in traditionally male-dominated fields such as construction, mining, and utilities.
- Shifting Demographics in Public Education: New hires in public schools show modest gains in racial diversity. However, school leadership positions lack racial diversity, with 62% of principal roles held by white employees.
- Public Education Workforce is Predominantly Female: Women comprise 77% of the public education workforce, and more than 74% of new hires, reflecting long-standing gender imbalances in the field.
- Progress in Finance and Professional Services: These sectors show more balanced gender representation than traditionally expected, indicating positive movement toward workplace representation.
- Asian Workers Often Concentrated in Professional Fields: Asian employees have relatively high representation in professional roles, especially in healthcare, tech, and information and scientific sectors.
Massachusetts Workforce Data Interactive Dashboard
How to Use the Dashboard
For the best user experience, please visit the dashboard using a laptop or desktop computer. The dashboard is organized into four sections or “views.” Select a view from the home page and click the icon in the top right corner to return to the home page. Use the drop-down filters to customize and filter the data, and hover your cursor over the visualizations for more information.
Reference & Data Download
Data Source
The team received 3,014 EEO-1 forms, which in total represent more than 816,000 employee records, or about 40% of the total Massachusetts private workforce. Additionally, 36 EEO-5 forms were submitted, which reflects approximately 22,000 employees, or about 15% of all public school district employees.
The definitions of each EEO report are as follows:
- EEO-1 Form: Private employers with 100+ employees. The EEOC did not require the pay data collection report known as Component 2 to be submitted during the covered period, therefore it is not part of this analysis. Massachusetts received 3,014 EEO-1 forms in 2025.
- EEO-5 Form: Public elementary and secondary school systems and districts with 100+ employees. Massachusetts received 36 forms in 2025.
For more details on data collection and reporting standards, please see Workforce Data Reporting FAQs.
Securing the Data
Several steps were taken to protect data and identity of respondents. These include physical and logical access controls, cryptographically secure multi-party computation to provide end-to-end data confidentiality, and differential privacy techniques. More information about data security can be found in the Methodology section of the full report.
Organizational Sizes
For the EEO-1 analysis, the team created a variable called “organizational size” that classifies EEO-1 organizations into four categories based on the number of employees they report. The approximate composition of these categories is as follows:
- Small: 200 or fewer employees
- Medium: more than 200 but less than 600 employees
- Large: more than 600 but less than 2,500
- Very Large: more than 2,500 employees
Download Data Spreadsheets
-
Open XLSX file, 220.56 KB, 2025 Workforce Data (EEO-1) (English, XLSX 220.56 KB)
-
Open XLSX file, 29.45 KB, 2025 Workforce Data (EEO-5) (English, XLSX 29.45 KB)