Author: Tony Rassias, Bureau of Accounts Deputy Director
The following piece details July 1, 2025 free cash certifications completed thus far compared to their previous certification. At the time of this writing, 343 cities and towns have free cash certified as of July 1, 2025, of which two have been certified in the negative. This article will also focus on appropriations from July 1, 2024 and July 1, 2025 certifications reported to the Bureau of Accounts (BOA).
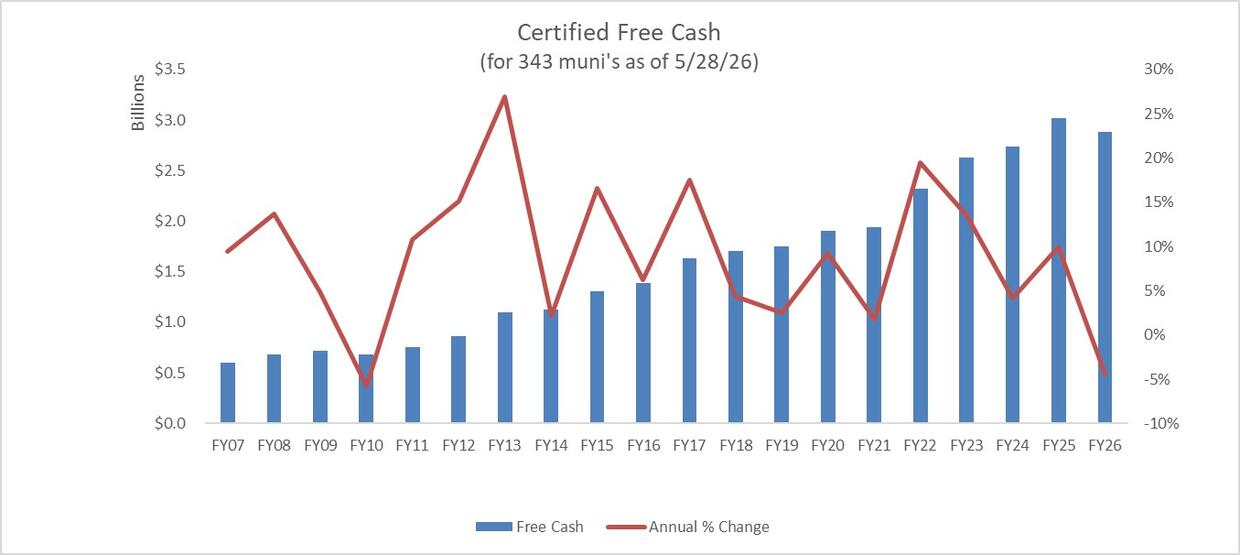
Free cash certifications thus far have totaled $2.88 billion, decreasing $139.8 million or 4.6% from their previous certification. This is the first decrease in total certified free cash since the Great Recession. Even if all 351 communities were to be certified by June 30, 2026, it appears highly doubtful that the current decrease can be reversed.
This total includes $883.7 million from FY2025 local estimated receipts above budget, $592.2 million from budgeted but unspent FY2025 appropriations and $1.4 billion from unobligated July 1, 2024 certified free cash.
The greatest amount certified during this period was in Boston with $601.6 million and the least in Southampton with - $555,515. The greatest increase from its previous certification was in Boston at $49.4 million (8.9%) and the greatest decrease was in Cambridge at $48.9 million (-21.0%). The median for all increases is $550,646 and median for all decreases is $484,760.
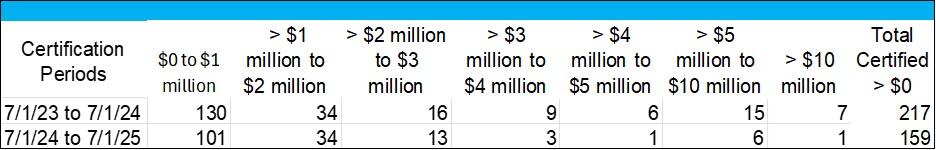
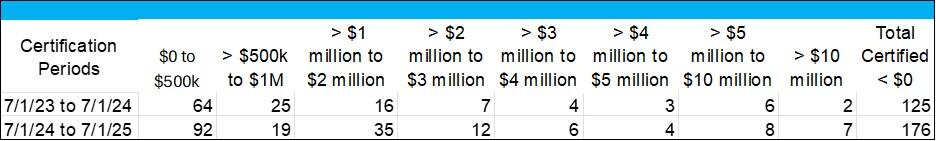
The next table categorizes the number of communities that increased free cash from their previous certification. The table that follows categorizes those that decreased.
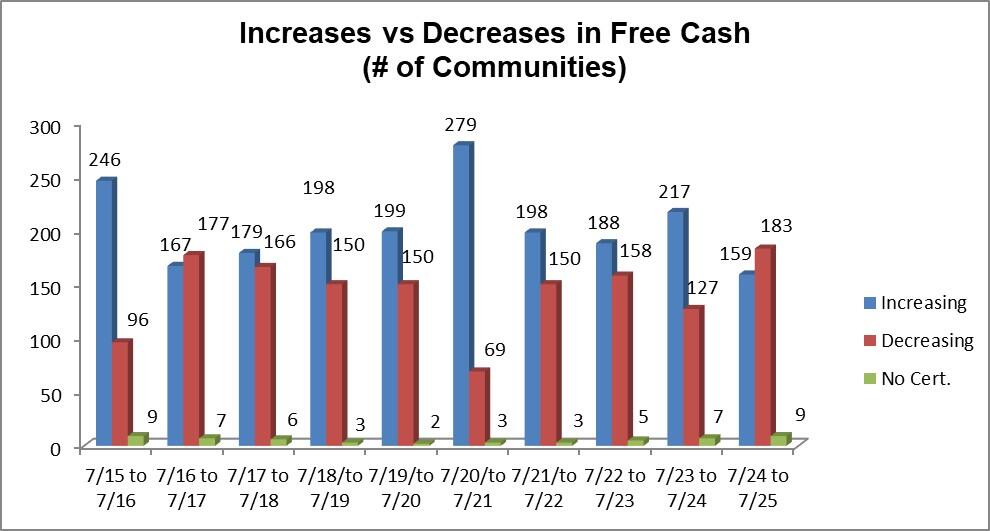
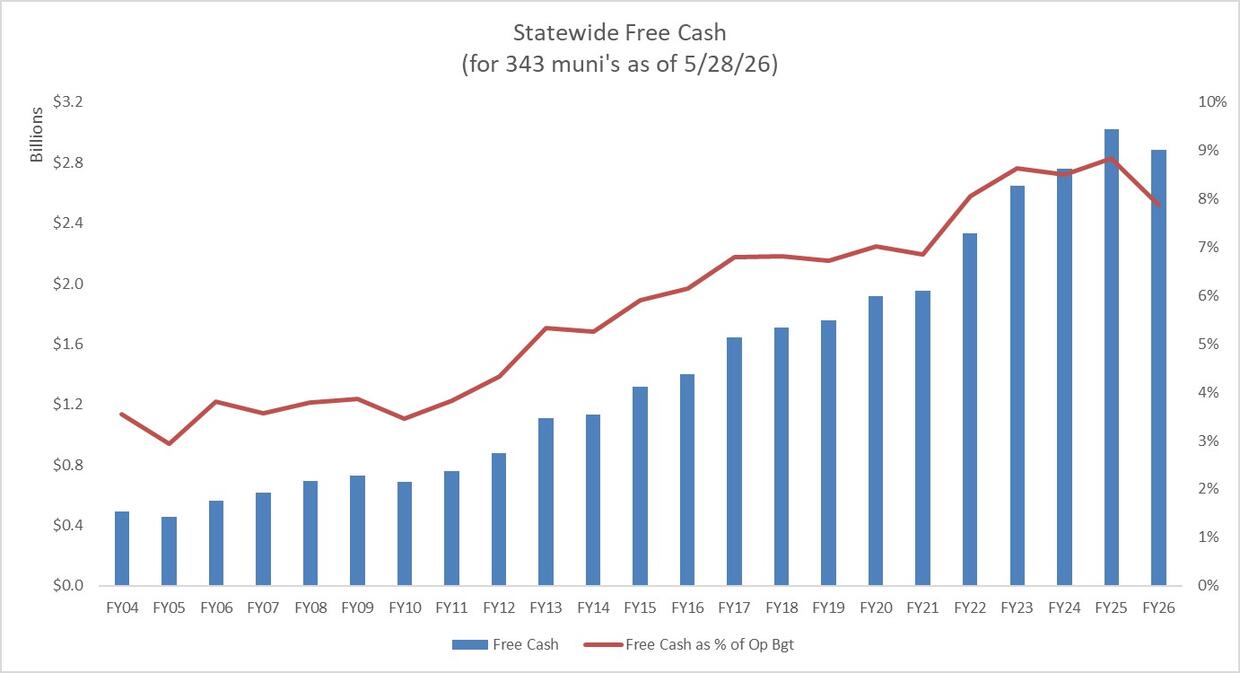
Despite any rise seen in a statewide total, not every community experiences an increase from the previous period, as shown in the graph below.
The graph below shows certified free cash for the past two decades, in both total dollars and as a percent of budget, for the same 343 municipalities with free cash certified as of July 1, 2025 (FY26). It shows that when measured as a percentage of the aggregate operating budgets for cities and towns in the data set, free cash has grown from less than 4% to 8%.
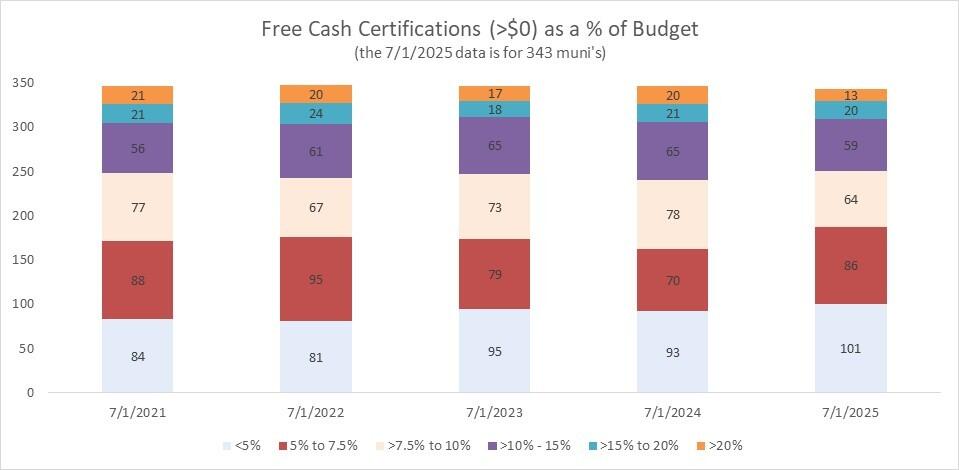
The following table depicts the distribution of free cash measured as a percentage of the operating budget. Follow this helpful link to view updated data on free cash certifications including percentages of the operating budget.
DLS offers additional information on the free cash calculation process. Our Bureau of Accounts (BOA) does not receive information as to the purpose of each appropriation. However, BOA can determine whether the appropriation was made in total for a particular purpose, to “reduce the tax rate”, or a combination of both, up until the tax rate is certified. Free cash must be appropriated but only after being certified by BOA.
Now let’s look at what we know about how July 1, 2024 (FY25) appropriations from free cash certifications were made. Only one community appropriated $0 from its certification, 55 appropriated their entire certification and 14 left unappropriated less than $1,000. The following graph shows the range of free cash appropriated and the number of communities in that range.
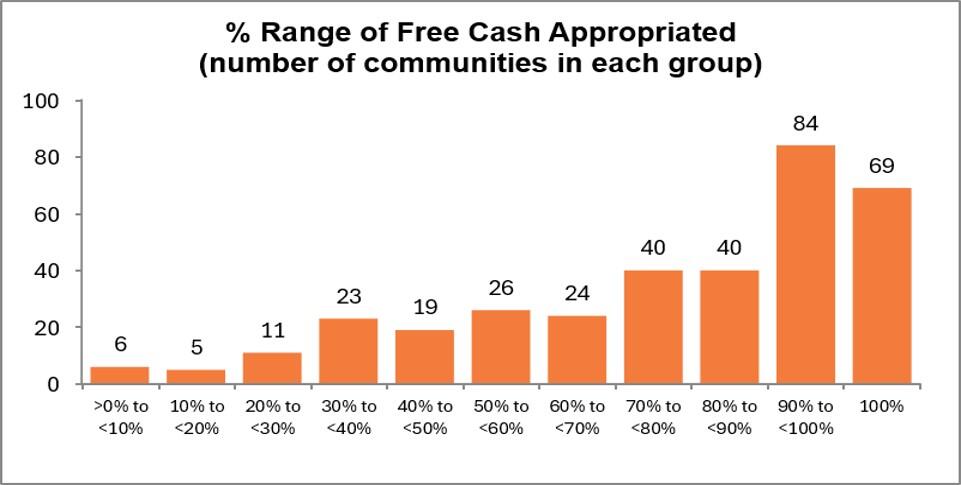
Free cash was appropriated by 290 communities for particular purposes only, while 48 voted a combination of particular purposes and to reduce the FY2025 and/or FY2026 tax rate. No communities appropriated free cash to reduce the FY2025 tax rate only, three voted to reduce the FY2026 tax rate only and one took no vote. The total amount appropriated was $1.6 billion or 54% of the total statewide July 1, 2024 certification.
Now let’s look at what we know about how appropriations from July 1, 2025 (FY26) free cash certifications were made up through approval of their FY2026 tax rate. This certified amount may be appropriated until June 30, 2026. About a third of communities reported some appropriation with 107 voting for particular purposes only, seven appropriated their entire certification, six voted for particular purposes and to reduce the FY2026 tax rate, and four reduced FY2026 only.
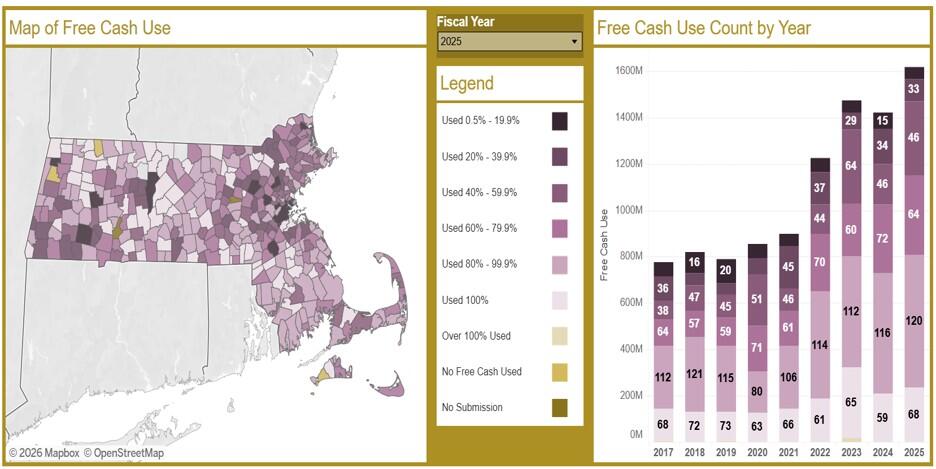
The following visualization found on our website represents the amount of free cash being appropriated against each fiscal year’s budget.
We hope you find this article interesting and informative. To learn more, DLS offers the Municipal Financial Self-Assessment and the Municipal Finance Trend Dashboard tools for community-specific data trended over a multi-year period.
Helpful Resources
City & Town is brought to you by:
Editor: Dan Bertrand
Editorial Board: Tracy Callahan, Sean Cronin, Janie Dretler, Emily Izzo, Christopher Ketchen, Paula King, Jen McAllister, Jessica Sizer and Tony Rassias
| Date published: | June 4, 2026 |
|---|