Delayed Hiring Trend Analysis by Fiscal Year
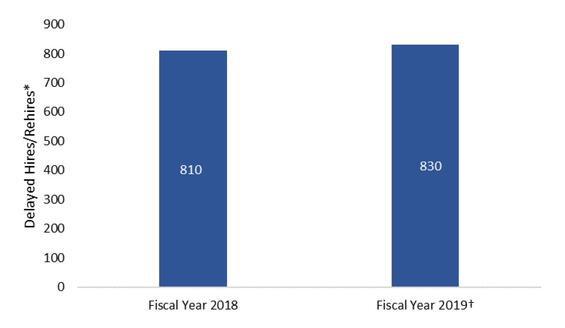
* One employee can have multiple positions in multiple departments and be hired/rehired multiple times during a given period, so one employee identification number (ID) could be associated with multiple occurrences of delayed hiring.
† Our audit period is July 1, 2017 through March 31, 2019; however, our trend analysis above includes the full fiscal year 2019, through June 30, 2019.
“There was a slight increase in delayed hires/rehires from fiscal year 2018 to fiscal year 2019.”
Delayed Hiring Trend Analysis by Calendar Year
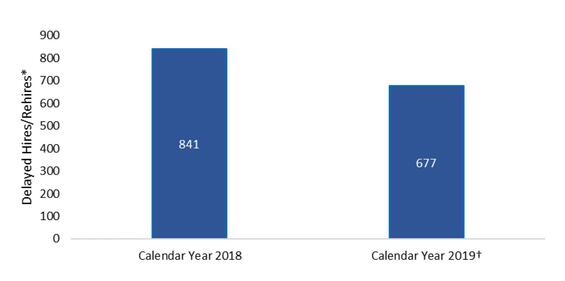
* One employee can have multiple positions in multiple departments and be hired/rehired multiple times during a given period, so one employee ID could be associated with multiple occurrences of delayed hiring.
† Our audit period is July 1, 2017 through March 31, 2019; however, our trend analysis above includes the full calendar year 2019, through December 31, 2019.
“Although there was a 20% decrease in delayed hires/rehires from calendar year 2018 through calendar year 2019, there was still a significant number of total occurrences (677).”
| Date published: | January 19, 2021 |
|---|