Overview
In accordance with Section 12 of Chapter 11 of the Massachusetts General Laws, the Office of the State Auditor has conducted a performance audit of certain activities of the Pension Reserves Investment Management Board (PRIM) for the period July 1, 2022 through June 30, 2024.
We conducted this performance audit in accordance with generally accepted government auditing standards. Those standards require that we plan and perform the audit to obtain sufficient, appropriate evidence to provide a reasonable basis for our findings and conclusions based on our audit objectives. We believe that the evidence obtained provides a reasonable basis for our findings and conclusions based on our audit objectives.
Below is a list of our audit objectives, indicating each question we intended our audit to answer; the conclusion we reached regarding each objective; and, if applicable, where each objective is discussed in the audit findings.
| Objective | Conclusion |
|---|---|
| To a sufficient extent |
| To a sufficient extent |
| To a sufficient extent |
To accomplish our audit objectives, we gained an understanding of the PRIM internal control environment relevant to our objectives by reviewing PRIM’s internal control plan and applicable policies and procedures, conducting site visits, and interviewing PRIM management. We also tested the operating effectiveness of internal controls for the approval of management fees. In addition, to obtain sufficient, appropriate evidence to address our audit objectives, we performed the procedures described below.
Emerging Managers
To determine to what extent PRIM reviewed the portfolios of emerging managers against its benchmarks to ensure that the PRIT Fund was not exposed to undue risks in accordance with Section 5 of PRIM’s “Investment Policy Statement,” we selected a random, nonstatistical8 sample of 35 from a population of 221 emerging managers who had assets under management (AUM) under $2 billion. For each selected emerging manager, we reviewed the performance report from the custodian bank and compared the benchmarks approved by PRIM to the actual fund performance. We also examined PRIM’s quarterly monitoring summary reports for each emerging manager in our sample to determine whether PRIM tracked the performance of these managers. Furthermore, we reviewed the archived meeting details from the customer relationship management software to confirm that PRIM documented the quarterly performance meeting between PRIM and the investment manager.
For this objective, we found no significant issues during our testing. Therefore, we concluded that, based on our testing, PRIM reviewed the portfolios of emerging managers against its benchmarks to ensure that the PRIT Fund was not exposed to undue risks.
Investment Managers
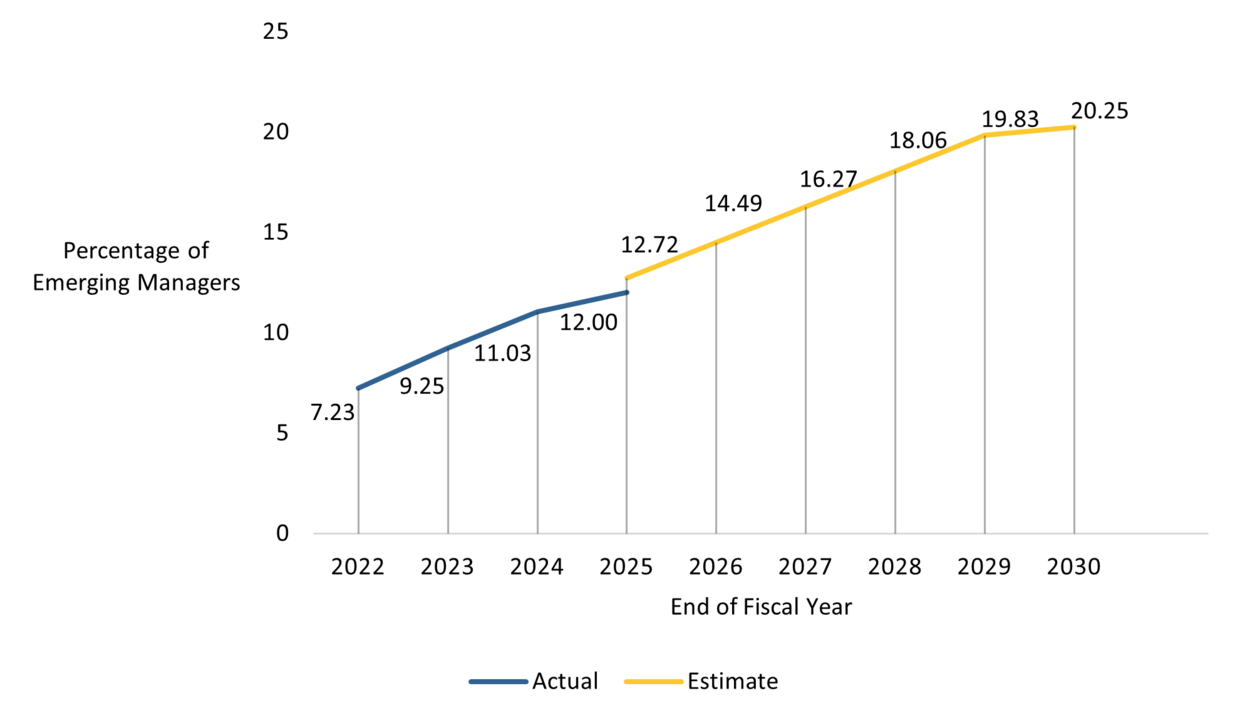
To determine to what extent PRIM worked toward its goal of having at least 20% of investment managers who are minorities, women, and people with disabilities, in accordance with Section 23(8)(b) of Chapter 32 of the General Laws, we obtained a list of investment managers associated with 730 management fee accounts, which also included each manager’s net asset data and quarterly status. We then calculated the percentage of net assets managed by emerging managers and used this information to compare PRIM’s progress in meeting the 20% goal. Additionally, we developed a forecast in Tableau9 to estimate when PRIM is expected to achieve its goal of having 20% of emerging managers overseeing the PRIT Fund, based on trends that were current as of June 30, 2024. We anticipate that PRIM will reach the target of having 20% of its PRIT Fund investment managers with a status of emerging manager by the first quarter of 2030.
The graph below shows both the growth trend of emerging managers who managed the PRIT Fund during the audit period and the projected date that PRIM is expected to achieve the 20% goal.
PRIM’s Emerging Manager Growth Trend
For this objective, we found no significant issues during our testing. Therefore, we concluded that, based on our testing, PRIM worked toward its goal of having at least 20% of investment managers who are minorities, women, and people with disabilities.
The table below shows the change in net asset value (NAV) by the emerging manager as of June 30, 2023 and June 30, 2024.
| Emerging Manager | NAV at June 30, 2023 | NAV at June 30, 2024 | Percentage Change |
|---|---|---|---|
| 1315 Capital | $1,310,971 | $2,692,254 | 105% |
| Adelante Capital Management | 20,620,155 | 22,397,232 | 9% |
| ARGA Investment Management, LP | 656,069,819 | 730,598,433 | 11% |
| Bayard Asset Management | 26,643,025 | 32,671,909 | 23% |
| BentallGreenOak | 25,338,754 | 60,333,902 | 138% |
| Bivium Capital Partners, LLC | (82,673) | (98,961) | 20% |
| Canvas Capital | 139,274,856 | 106,853,778 | -23% |
| Capula Management Limited | 552,382,545 | 590,622,747 | 7% |
| Causeway Capital Management LLC | 488,273,873 | 548,632,911 | 12% |
| Complus Asset Management Limited | 320,896,089 | 398,665,442 | 24% |
| Consilium Investment Management | - | 28,168,896 | 100% |
| Contrarian Capital Management | 290,968,027 | 455,141,400 | 56% |
| Ducenta Squared Asset Management | 39,058,331 | 40,182,833 | 3% |
| Fithian LLC | 31,099,495 | 31,797,407 | 2% |
| Flagship Pioneering | 364,511,275 | 259,005,835 | -29% |
| Frontier Global Partners, LLC | 26,386,152 | 28,020,195 | 6% |
| GIA Partners | 31,066,918 | 34,730,663 | 12% |
| Global Infrastructure Finance | - | 21,461,075 | 100% |
| HongShan Capital | 2,916,028 | 8,138,927 | 179% |
| Integrated Quantitative Investments | - | 26,233,662 | 100% |
| Kah Capital Management | - | 11,862,270 | 100% |
| Kepha Partners | 8,421,769 | 11,307,227 | 34% |
| Keytone Ventures | 20,930,213 | 20,381,311 | -3% |
| Kinzie Capital Partners | 1,255,330 | 3,672,438 | 193% |
| Knox Lane | - | 2,901,998 | 100% |
| LM Capital Group | 30,518,196 | 32,839,852 | 8% |
| Longfellow Investment Management Co., LLC | 472,658,598 | 602,219,528 | 27% |
| Loop Capital Asset Management | 31,805,955 | 33,181,280 | 4% |
| Maytech Global Investments | - | 35,316,292 | 100% |
| Merit Hill Capital | 7,660,005 | 8,461,353 | 10% |
| New Century Advisors, LLC | 397,453,638 | 487,230,049 | 23% |
| NewView Capital | 1,800,000 | 7,513,576 | 317% |
| Osso Capital | 2,851,483 | 4,161,766 | 46% |
| Pacific Alternative Asset Management Company | 712,459,640 | 771,943,728 | 8% |
| Polaris Venture Partners | 43,879,850 | 42,010,188 | -4% |
| Pugh Capital Management, Inc. | 463,911,769 | 588,985,643 | 27% |
| Pzena Investment Management LLC | 1,437,082,638 | 1,472,636,865 | 2% |
| Red Arts Capital | 4,311,116 | 5,940,941 | 38% |
| RhumbLine Advisers | 2,085,611,569 | 3,830,268,006 | 84% |
| RV Capital Management Private Ltd | 270,751,035 | 300,082,001 | 11% |
| Tidemark | 12,309,457 | 22,540,922 | 83% |
| Trio Net Lease I | 1,862,606 | 6,734,657 | 262% |
| Vision Capital | 1,106,896 | 2,866,753 | 159% |
| Vista Equity Partners | 241,127,196 | 254,305,375 | 5% |
| Vistria Housing Fund | - | 15,000,000 | 100% |
| Wing Ventures | - | 1,404,202 | 100% |
| Xponance Asset Management | 346,910,789 | 370,726,745 | 7% |
| Redwood Investments | 23,957,263 | 25,212,390 | 5% |
| TowerBrook Capital Partners | 288,337,210 | 340,109,372 | 18% |
| Total | $9,925,707,861 | $12,738,067,268 |
The total NAV for all of PRIM’s investment managers (including emerging managers) for fiscal years 2023 and 2024 were $107,283,709,700 and $115,443,314,509, respectively.
Management Fees and Investment Returns
To determine to what extent PRIM reviewed the quarterly calculations of management fees and investment returns in accordance with the third operational risk category of Section V (Risk Analysis) of its Investment and Operations Risk Control Document, we took the following actions. We reviewed a list of management fee accounts for fiscal year 2023 (totaling $94,747,548) and fiscal year 2024 (totaling $122,069,820), totaling 730 management fee accounts for both years, and reconciled the data back to the audited financial statements.
We selected a random, nonstatistical sample of 20 management fee accounts and examined quarterly invoices from the audit period, totaling 160 invoices (20 accounts multiplied by 8 quarters equals 160). Using the management fee structure defined in the contracts for each management fee account in our sample, we recalculated the management fees for each quarter and compared them to the invoice amount. Furthermore, we ensured that the appropriate individuals approved the invoices on behalf of PRIM. Additionally, we reviewed PRIM’s approvals of the returns on the investment calculation, which is included in the Net of Fees report issued by the custodian bank for each quarter.
To understand how management fees affect return on investment, see Appendix. It clearly shows the link between management fees and investment performance, which is essential for making informed decisions.
For this objective, we found no significant issues during our testing. Therefore, we concluded that, based on our testing, PRIM reviewed the quarterly calculations of management fees and investment returns.
We used nonstatistical sampling methods for testing and therefore did not project the results of our testing to any population.
Data Reliability Assessment
To assess the reliability of PRIM’s emerging and investment manager AUM and the list of total management fees from the PRIM investment management system, we interviewed PRIM officials who were knowledgeable about the data.
We reviewed the System and Organization Control reports10 for the audit period, which included, but were not limited to, testing security management, access controls, configuration management, segregation of duties, and contingency planning.
For the list of emerging and investment managers with AUM, we obtained and reviewed a list of PRIM’s total investments, including investments with emerging managers, from the PRIM custodian bank’s information system, which included the source account names and AUM amounts of PRIM’s investment managers. We obtained and reviewed a list of the names of investment managers from the relationship management system. We reconciled PRIM’s performance measurement from the Net of Fees report for each quarter of the audit period.
Additionally, we compared the list of all of PRIM’s investment managers to the relationship management software to verify diversity information, such as investment managers who identify themselves as minorities, women, or people with disabilities. We randomly selected a sample of 10 emerging managers from the list of investment and emerging managers and confirmed that the investment managers who had a status of AUM under $2 billion was either minority- or woman-owned. We tested the list of investment and emerging managers for any duplicate records.
For the list of management fees, we reconciled the list with the custodian bank and the audited financial statements for fiscal years 2023 and 2024.
Based on the results of the data reliability assessment procedures described above, we determined that the information we obtained during the course of our audit was sufficiently reliable for the purposes of our audit.
Conclusion
Our audit revealed no significant issues that must be reported under generally accepted government auditing standards. Therefore, we concluded that, during the audit period, PRIM met the relevant criteria regarding our objectives.
| Date published: | November 13, 2025 |
|---|