Official websites use .mass.gov
A .mass.gov website belongs to an official government organization in Massachusetts.
Secure websites use HTTPS certificate
A lock icon ( ) or https:// means you've safely connected to the official website. Share sensitive information only on official, secure websites.
Disclaimer: This feature uses the Google Translate Widget. Due to the limitation of machine translation, some pages or content may not be translated accurately.
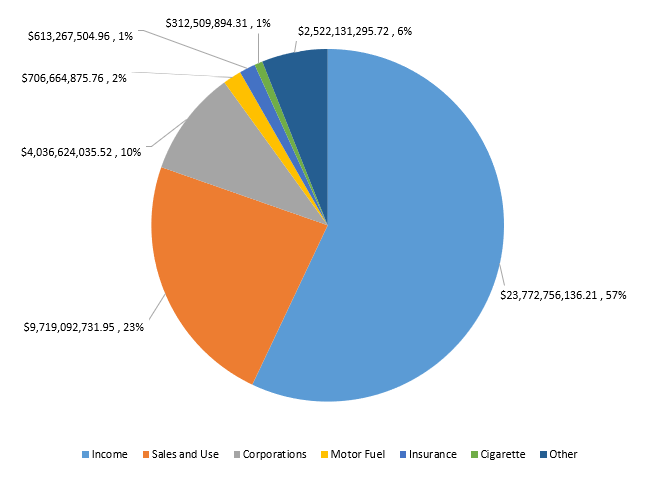
* Percentages are rounded to the nearest whole number.
The feedback will only be used for improving the website. If you need assistance, please contact the State Auditor. Please limit your input to 500 characters.
Thank you for your website feedback! We will use this information to improve this page.
If you would like to continue helping us improve Mass.gov, join our user panel to test new features for the site.