Overview
On March 10, 2020, Massachusetts Governor Charles Baker issued a Declaration of a State of Emergency in response to the COVID-19 pandemic. On March 13, 2020, President Donald Trump issued a similar declaration of a national emergency. The COVID-19 pandemic has effected nearly every aspect of government work, including the work of BSI. Beginning in March 2020, BSI staff members transitioned to working outside of their primary office locations in Boston, Chicopee, and Brockton. Although faced with unprecedented challenges, the work of BSI continued by using technology and innovation. The fiscal year 2020 (FY20) Bureau of Investigations Annual Report summarizes BSI’s work and initiatives to execute the Office of the State Auditor’s mission to make government work better. This is done through BSI’s statutory charge to investigate fraud, abuse, and illegal acts involving public assistance benefits throughout the Commonwealth. During FY20, BSI continued to investigate and identify fraud in order to maintain program integrity and uphold the Commonwealth’s residents’ faith in public assistance programs. BSI’s efforts ensure that public assistance programs operate with transparency so that benefits are available to residents who truly need them.
In FY20, BSI opened 3,770 new investigations and completed 4,191 total investigations.2 This report includes a comprehensive breakdown of the fraud identified within each program BSI investigates. Of the 482 completed cases with identified fraud,3 the average amount of fraud was $16,938.67.
“In FY20, BSI identified $8,164,438.85 in fraud.”
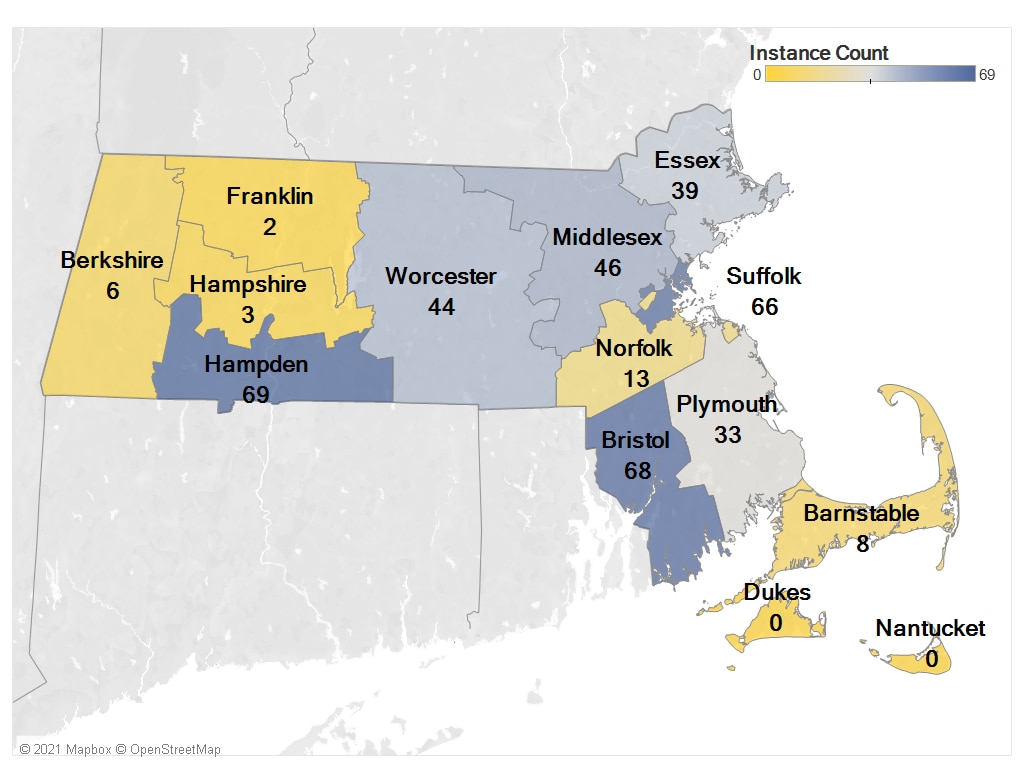
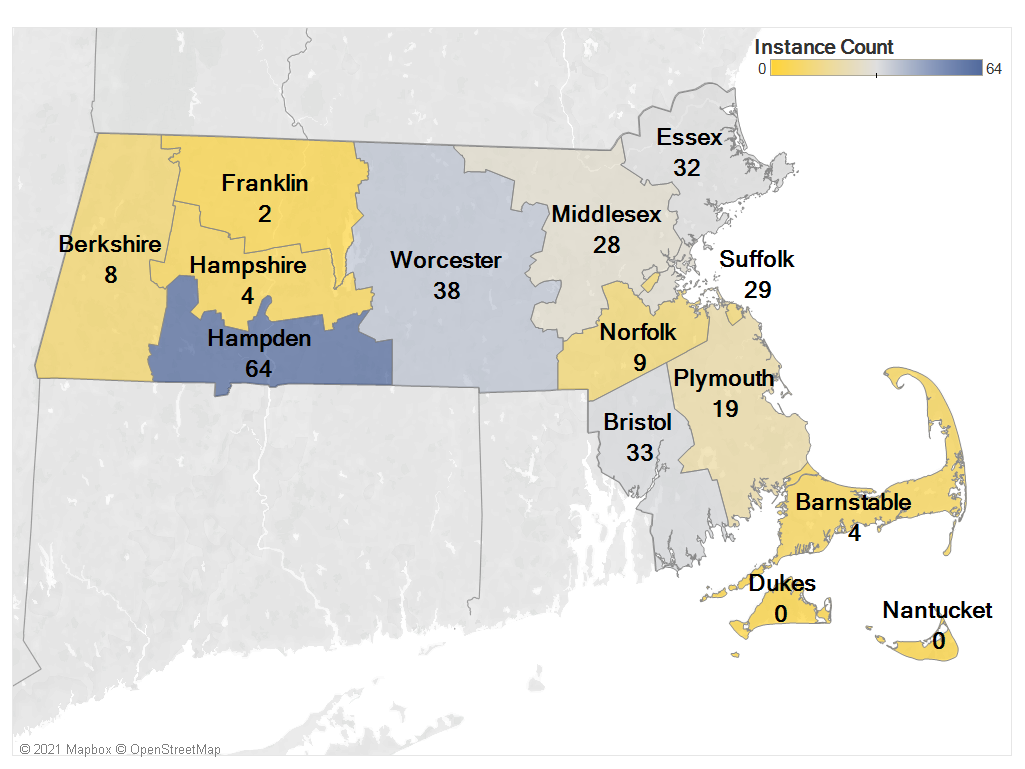
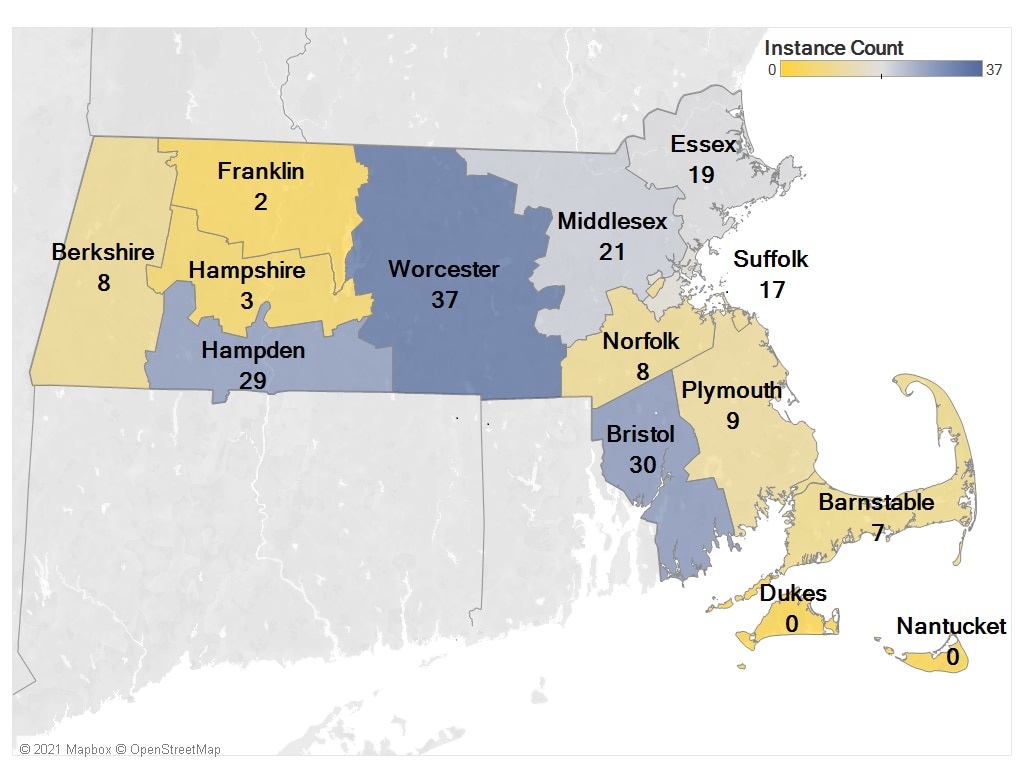
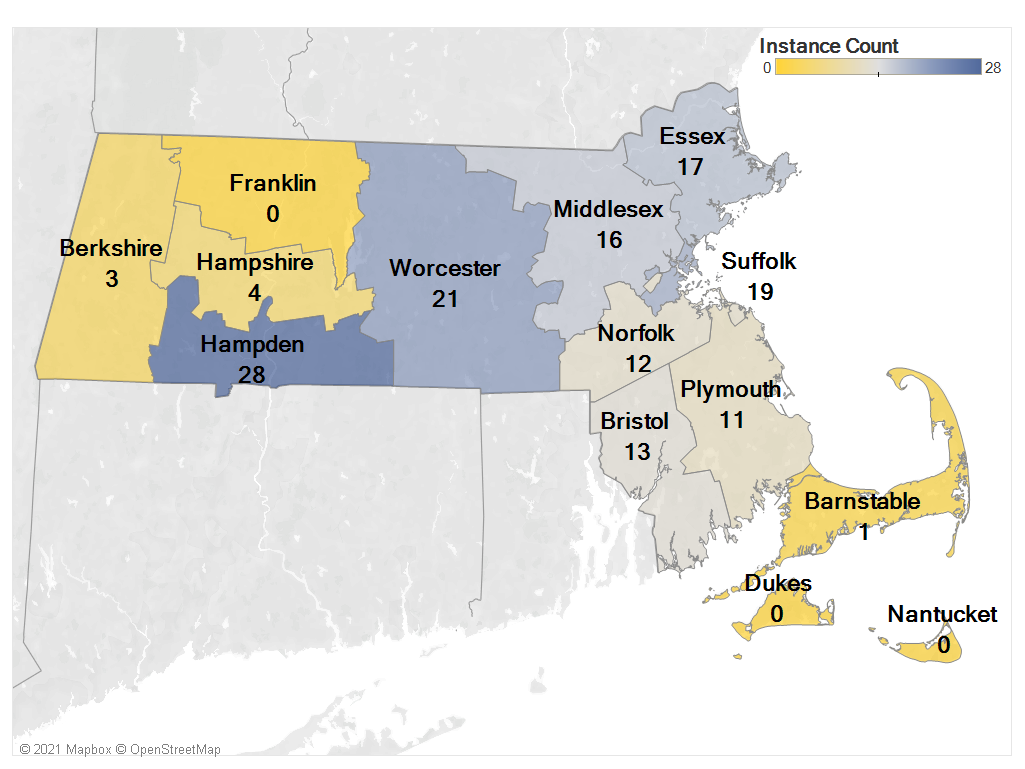
Public assistance programs administered by the Department of Transitional Assistance, the Department of Early Education and Care, and MassHealth provide vital social services for the Commonwealth’s most vulnerable and disadvantaged residents—children, persons with disabilities, low-income individuals and families, and seniors. Statistical data on BSI cases from FY20 demonstrates that the cases BSI investigated most frequently involved allegations of undisclosed employment, an unreported non-custodial parent in the home, or a dependent no longer in the home. By contrast, BSI investigated cases with allegations of other earners in the home the least. Looking at the cases BSI investigated during FY20 from a different perspective, the geographical statistical data shows that Hampden, Worcester, and Bristol Counties generated the most allegations overall. Dukes, Nantucket, and Franklin Counties generated the least number of allegations.
Highlighting the new capabilities of the Data Analytics Unit’s analytical support services, the following maps illustrate FY20’s total fraud allegations by county.
Figure 1. Fiscal Year 2020 (FY20) Total Fraud Instances by County
Note: The total number of allegations is higher than the total completed case count because there are often multiple allegations per BSI case number. The grand total as reflected does not filter out duplicate BSI case numbers; the count only includes the unique number of allegations.
Table 1A. FY20 Total Fraud Allegations by Allegation Type and County
|
Allegation |
Barnstable |
Berkshire |
Bristol |
Dukes |
Essex |
Franklin |
Hampden |
Total |
|---|---|---|---|---|---|---|---|---|
|
Assets |
1 |
1 |
4 |
0 |
6 |
0 |
3 |
15 |
|
Child Care |
0 |
0 |
0 |
0 |
0 |
0 |
0 |
0 |
|
Dependent Not in Home |
7 |
8 |
30 |
0 |
19 |
2 |
29 |
95 |
|
EBT Fraud |
0 |
0 |
0 |
0 |
1 |
0 |
0 |
1 |
|
Employment |
8 |
6 |
68 |
0 |
39 |
2 |
69 |
192 |
|
False Identity |
0 |
0 |
0 |
0 |
5 |
0 |
0 |
5 |
|
Multiple Assistance |
0 |
0 |
2 |
0 |
0 |
0 |
1 |
3 |
|
NCP Present |
4 |
8 |
33 |
0 |
32 |
2 |
64 |
143 |
|
Non Resident |
3 |
1 |
10 |
0 |
8 |
1 |
10 |
33 |
|
Other |
0 |
0 |
1 |
0 |
0 |
0 |
0 |
1 |
|
Other Earner in the Home |
1 |
3 |
13 |
0 |
17 |
0 |
28 |
62 |
|
Out of State |
0 |
1 |
3 |
0 |
8 |
2 |
6 |
20 |
|
Personal Care Attendant |
2 |
5 |
3 |
0 |
9 |
1 |
8 |
28 |
|
Subject Living Above Means |
3 |
2 |
19 |
0 |
8 |
1 |
21 |
54 |
|
Support Payments |
0 |
0 |
3 |
0 |
2 |
0 |
1 |
6 |
|
Trafficking |
0 |
0 |
2 |
0 |
0 |
0 |
0 |
2 |
|
Unemployment Compensation |
0 |
1 |
0 |
0 |
0 |
0 |
1 |
2 |
|
Grand Total |
29 |
36 |
191 |
0 |
154 |
11 |
241 |
662 |
Table 1B. FY20 Total Fraud Allegations by Allegation Type and County
|
Allegation |
Hampshire |
Middlesex |
Nantucket |
Norfolk |
Plymouth |
Suffolk |
Worcester |
Grand Total |
|---|---|---|---|---|---|---|---|---|
|
Assets |
2 |
2 |
0 |
2 |
1 |
4 |
3 |
14 |
|
Child Care |
0 |
1 |
0 |
0 |
0 |
0 |
0 |
1 |
|
Dependent Not in Home |
3 |
21 |
0 |
8 |
9 |
17 |
37 |
95 |
|
Electronic Benefit Transfer Fraud (EBT) Fraud |
0 |
1 |
0 |
0 |
2 |
0 |
1 |
4 |
|
Employment |
3 |
46 |
0 |
13 |
33 |
66 |
44 |
205 |
|
False Identity |
0 |
1 |
0 |
0 |
0 |
2 |
1 |
4 |
|
Multiple Assistance |
1 |
1 |
0 |
0 |
0 |
1 |
4 |
7 |
|
Non-Custodial Parent (NCP) Present |
4 |
28 |
0 |
9 |
19 |
29 |
38 |
127 |
|
Non Resident |
1 |
3 |
0 |
3 |
4 |
11 |
7 |
29 |
|
Other |
0 |
0 |
0 |
0 |
0 |
0 |
0 |
0 |
|
Other Earner in the Home |
4 |
16 |
0 |
12 |
11 |
19 |
21 |
83 |
|
Out of State |
0 |
5 |
0 |
1 |
2 |
6 |
8 |
22 |
|
Personal Care Attendant |
1 |
8 |
0 |
1 |
2 |
12 |
6 |
30 |
|
Subject Living Above Means |
1 |
19 |
0 |
8 |
16 |
13 |
23 |
80 |
|
Support Payments |
0 |
2 |
0 |
1 |
0 |
1 |
0 |
4 |
|
Trafficking |
0 |
0 |
0 |
0 |
0 |
0 |
0 |
0 |
|
Unemployment Compensation |
0 |
1 |
0 |
1 |
1 |
1 |
0 |
4 |
|
Grand Total |
20 |
155 |
0 |
59 |
100 |
182 |
193 |
709 |
FY20 Itemized Fraud Instances by County
| Date published: | February 18, 2021 |
|---|