Exhibit I
Calculation to Determine Whether Net State Tax Revenues Exceeded Allowable State Tax Revenues for the Fiscal Year Ended June 30, 2019
|
Allowable State Tax Revenues for the Fiscal Year Ended June 30, 2019 |
$33,977,241,799 |
|
Less: |
|
|
Net State Tax Revenues for the Fiscal Year Ended June 30, 2019 |
30,202,588,989 |
|
Net State Tax Revenues (under) Allowable State Tax Revenues for the Fiscal Year Ended June 30, 2019 |
$(3,774,652,810) |
Exhibit II
Net State Tax Revenues for the Fiscal Year Ended June 30, 2019
|
Type of State Tax Collected |
Gross State Tax |
Refunds and |
Net State Tax |
|
Department of Revenue (DOR): |
|
|
|
|
Alcoholic Beverages |
$86,435,991 |
$240,931 |
$86,195,060 |
|
Financial Institutions |
22,957,961 |
3,490,805 |
19,467,156 |
|
Cigarettes* |
554,865,316 |
1,604,144 |
553,261,172 |
|
Corporations |
3,219,750,855 |
292,591,141 |
2,927,159,714 |
|
Deeds |
218,567,679 |
36,064 |
218,531,615 |
|
Estate and Inheritance |
623,539,437 |
22,233,481 |
601,305,956 |
|
Income* |
18,810,921,634 |
1,685,088,270 |
17,125,833,364 |
|
Insurance |
419,458,645 |
18,861,988 |
400,596,657 |
|
Motor Fuels and I.F.T.A.† |
779,708,562 |
4,245,895 |
775,462,667 |
|
Public Utilities |
40,000 |
0 |
40,000 |
|
Room Occupancy ‡ |
284,850,147 |
1,142,334 |
283,707,813 |
|
Sales and Use ‡ |
6,879,742,345 |
36,786,701 |
6,842,955,644 |
|
Club Alcoholic Beverages |
945,275 |
19,552 |
925,723 |
|
Motor Vehicle Excise |
101,094 |
23,821 |
77,273 |
|
Convention Center Surcharges |
17,001,373 |
91 |
17,001,282 |
|
Community Preservation Trust |
23,173,800 |
0 |
23,173,800 |
|
Controlled Substances |
13,948,855 |
0 |
13,948,855 |
|
Satellite |
8,605,108 |
0 |
8,605,108 |
|
Statewide Car Rental |
1,096,138 |
10 |
1,096,128 |
|
Subtotal (Department of Revenue) |
$31,965,710,215 |
$2,066,365,228 |
$29,899,344,987 |
|
Massachusetts Gaming Commission: |
|
|
|
|
Pari-Mutuel Taxes |
788,306 |
0 |
788,306 |
|
Gaming Revenue Tax |
130,701,550 |
0 |
130,701,550 |
|
Lottery Commission: |
|
|
|
|
Beano |
697,460 |
0 |
697,460 |
|
Raffles and Bazaars |
1,123,098 |
0 |
1,123,098 |
|
State Athletic Commission: |
|
|
|
|
Boxing Contests |
125,966 |
0 |
125,966 |
|
Boxer’s Fund |
12,643 |
0 |
12,643 |
|
Division of Insurance: |
|
|
|
|
Excess and Surplus Lines Insurance |
44,848,231 |
0 |
44,848,231 |
|
Secretary of State: |
|
|
|
|
Deeds Excise Stamp Tax Fees |
99,815,285 |
0 |
99,815,285 |
|
Department of Unemployment Assistance: |
|
|
|
|
Workforce Training Contribution |
25,131,463 |
0 |
25,131,463 |
|
Subtotal (Other Agencies) |
$303,244,002 |
$0 |
$303,244,002 |
|
Total (Department of Revenue |
$32,268,954,217 |
$2,066,365,228 |
$30,202,588,989 |
* Includes income tax penalties assessed under Section 2 of Chapter 111M of the General Laws (totaling $16,574,378) and cigarette excise revenue assessed in accordance with Sections 12 and 70 of Chapter 302 of the Acts of 2008 (totaling $113,439,387) credited to the Commonwealth Care Trust Fund (CCTF). Fiscal year 2018 tax revenues credited to the CCTF totaled $130,013,765.
† International Fuel Tax Agreement.
‡ Includes sales, meals, and room occupancy excise taxes, and service fees for the City of Worcester DCU Capital Improvement Fund.
Exhibit III
Net State Tax Revenue Sources for the Fiscal Year Ended June 30, 2019
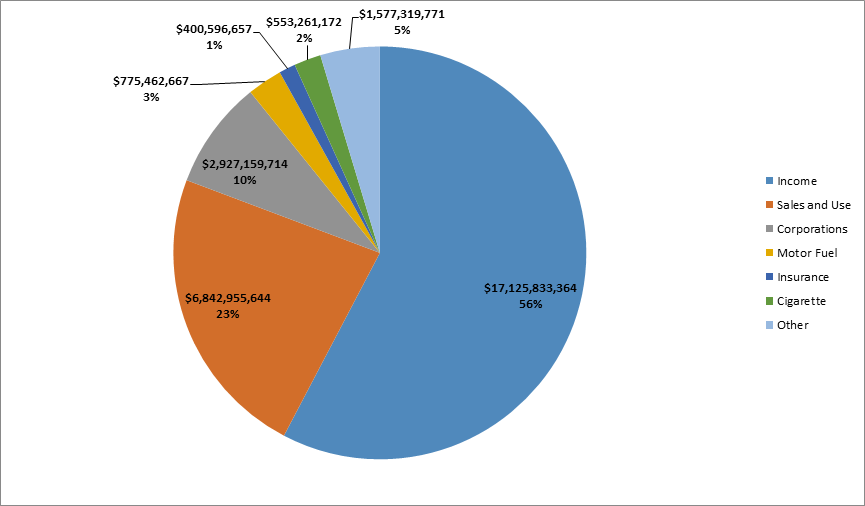
Exhibit IV
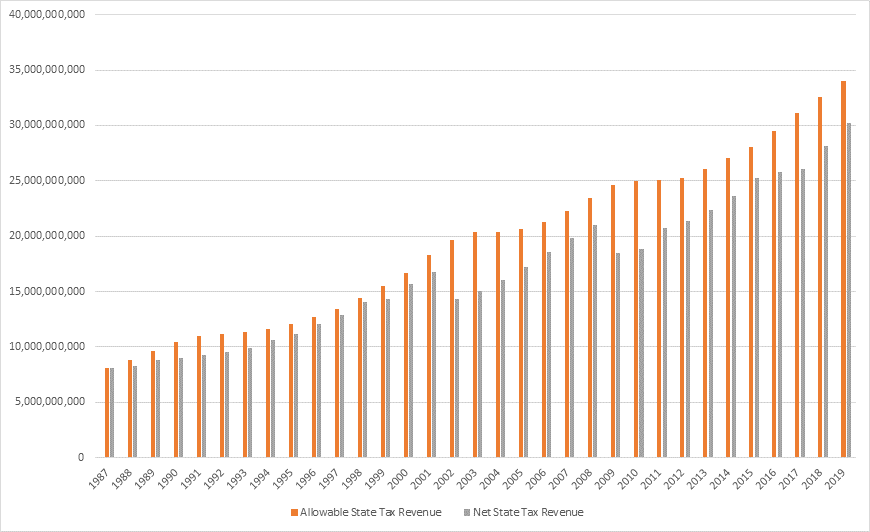
Calculation of Allowable State Tax Revenues for the Fiscal Year Ended June 30, 2019
|
Allowable State Tax Revenues for the Fiscal Year Ended June 30, 2018* |
$32,531,393,763 |
|
Allowable State Tax Growth Factor for the Fiscal Year Ended June 30, 2019 |
x 1.0444447 |
|
Allowable State Tax Revenues for the Fiscal Year Ended June 30, 2019 |
$33,977,241,799 |
* As defined in Section 2 of Chapter 62F of the Massachusetts General Laws, “allowable state tax revenues” for a fiscal year means the following: beginning after June 30, 1986, an amount equal to the greater of the allowable state tax revenues for the immediately preceding fiscal year multiplied by the allowable state tax growth for the current year, or in any case no less than the allowable state tax revenues for the preceding fiscal year. Allowable state tax revenues as disclosed in our prior report (No. 2019-5555-3S) totaled $32,531,393,763.
Exhibit V
Calculation of Allowable State Tax Growth Factor for the Fiscal Year Ended June 30, 2019
|
Calendar Year |
Massachusetts Wages and Salaries* |
Wages and Salaries |
|
2015 |
$233,424,075 |
|
|
2016 |
$246,671,099 |
1.0567509 |
|
2017 |
$251,844,339 |
1.0209722 |
|
2018 |
$265,849,684 |
1.0556111 |
| Sum of 2016–2018 Calendar Year Growth Increase | 3.1333342 | |
| Allowable State Tax Growth Factor for Fiscal Year 2019 (3.1333342/3) | 1.0444447 |
* Source: US Department of Commerce, Bureau of Economic Analysis, Regional Income Division, Washington, D.C. (pursuant to Section 2 of Chapter 62F).
† Wage and yearly growth ratio is calculated by dividing each calendar year’s wages and salaries by those of the previous calendar year.
Note: Chapter 62F requires that, in calculating the allowable state tax growth factor for any fiscal year, the same total for Massachusetts’s wages and salaries for a calendar year utilized in prior calculations involving that calendar year shall be utilized in subsequent calculations involving that calendar year, notwithstanding periodic adjustments by the Bureau of Economic Analysis.
The fiscal year 2019 allowable state tax growth factor decreased 0.0017428 from the prior year’s factor of 1.0461875.
Exhibit VI
Comparison of Net State Tax Revenues for the Two Fiscal Years Ended June 30, 2019
|
Type of State Tax Collected |
Net State Tax Revenues |
Net State Tax Revenues |
Increase/ |
Percentage |
|
Department of Revenue: |
|
|||
|
Alcoholic Beverages |
$86,195,060 |
$84,977,507 |
$1,217,553 |
1.43% |
|
Financial Institutions |
19,467,156 |
17,442,655 |
2,024,501 |
11.61% |
|
Cigarettes* |
553,261,172 |
594,172,849 |
(40,911,677) |
(6.89)% |
|
Corporations |
2,927,159,714 |
2,392,154,111 |
535,005,603 |
22.37% |
|
Deeds |
218,531,615 |
193,540,509 |
24,991,106 |
12.91% |
|
Estate and Inheritance |
601,305,956 |
472,955,859 |
128,350,097 |
27.14% |
|
Income* |
17,125,833,364 |
16,255,654,922 |
870,178,442 |
5.35% |
|
Insurance |
400,596,657 |
363,569,152 |
37,027,505 |
10.18% |
|
Motor Fuels and I.F.T.A.† |
775,462,667 |
769,144,085 |
6,318,582 |
0.82% |
|
Public Utilities |
40,000 |
(650,000) |
690,000 |
106.15% |
|
Room Occupancy‡ |
283,707,813 |
263,448,681 |
20,259,132 |
7.69% |
|
Sales and Use‡ |
6,842,955,644 |
6,491,262,465 |
351,693,179 |
5.42% |
|
Club Alcoholic Beverages |
925,723 |
864,506 |
61,217 |
7.08% |
|
Motor Vehicle Excise |
77,273 |
116,187 |
(38,914) |
(33.49%) |
|
Convention Center Surcharges |
17,001,282 |
17,177,597 |
(176,315) |
(1.03%) |
|
Community Preservation Trust |
23,173,800 |
23,793,880 |
(620,080) |
(2.61%) |
|
Controlled Substances |
13,948,855 |
7 |
13,948,848 |
1,992,693% |
|
Satellite |
8,605,108 |
9,721,141 |
(1,116,033) |
(11.48%) |
|
Statewide Car Rental |
1,096,128 |
0 |
1,096,128 |
NA |
|
Subtotal (Department of Revenue) |
$29,899,344,987 |
$27,949,346,113 |
$1,949,998,874 |
6.98% |
|
Massachusetts Gaming Commission: |
|
|
|
|
|
Pari-Mutuel Taxes |
788,306 |
886,950 |
(98,644) |
(11.12%) |
|
Gaming Revenue Taxes |
130,701,550 |
68,010,487 |
62,691,063 |
92.18% |
|
Lottery Commission: |
|
|
|
|
|
Beano |
697,460 |
730,836 |
(33,376) |
(4.57%) |
|
Raffles and Bazaars |
1,123,098 |
1,030,972 |
92,126 |
8.94% |
|
State Athletic Commission: |
|
|
|
|
|
Boxing Contests |
125,966 |
208,390 |
(82,424) |
(39.55%) |
|
Boxer’s Fund |
12,643 |
33,239 |
(20,596) |
(6,196%) |
|
Division of Insurance: |
|
|
|
|
|
Excess and Surplus Lines Insurance |
44,848,231 |
42,681,550 |
2,166,681 |
5.08% |
|
Secretary of State: |
|
|
|
|
|
Deeds Excise Stamp Tax Fees |
99,815,285 |
90,956,209 |
8,859,076 |
9.74% |
|
Department of Unemployment Assistance: |
|
|
|
|
|
Workforce Training Contribution |
25,131,463 |
24,675,801 |
455,662 |
1.85% |
|
Subtotal (Other Agencies) |
$303,244,002 |
$229,214,434 |
$74,029,568 |
32.30% |
|
Total (Department of Revenue |
$30,202,588,989 |
$28,178,560,547 |
$2,024,028,442 |
7.18% |
* Includes income tax penalties assessed under Section 2 of Chapter 111M of the General Laws and cigarette excise revenues credited to the Commonwealth Care Trust Fund in accordance with Sections 12 and 70 of Chapter 302 of the Acts of 2008.
† International Fuel Tax Agreement.
‡ Includes sales, meals, and room occupancy excise taxes, as well as service fees for the City of Worcester DCU Capital Improvement Fund.
Exhibit VII
| Date published: | September 16, 2019 |
|---|