Author: Financial Management Resources Bureau
In a previous article, we introduced the Levy Limit Financial Indicator tool and how it can serve as a gauge of a community’s fiscal wellbeing. Today, we will delve more specifically into one aspect of that tool, the override capacity as a percentage of the levy ceiling metric. Override Capacity is defined as the difference between the community’s levy ceiling (the amount equal to 2.5% of the community’s total property values and the maximum allowable levy, outside of any debt exclusions) and its levy limit (the maximum property tax levy for that year). It is the maximum amount by which a community may override its levy limit.
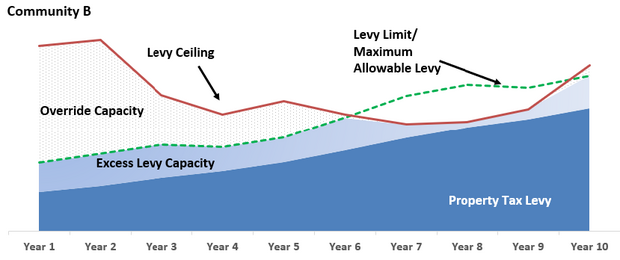
The graphs below illustrate how Community A has ample override capacity while Community B does not. Community A therefore has the ability to raise additional revenue through a Proposition 2 ½ override. Alternatively, Community B’s levy ceiling declined over a period of years because of declining real estate values, thereby reducing its override capacity and its ability to even propose an override. Note how the graph for Community B depicts its override capacity as percentage of the levy ceiling falling to 0% in year 6. Trending override capacity as a percentage of levy ceiling over time can be a useful indicator that offers policymakers a complete view oftheir community’s levy limit and how they might need to addresscurrent or future revenue constraints.
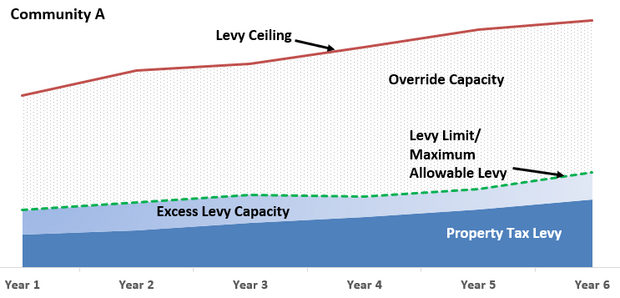
It is also important to note the importance of the relationship between override capacity and excess capacity, which is defined as the difference between what a community can levy (maximum allowable levy) and what it does levy. A community can reach its levy ceiling (i.e., have no override capacity) but still would be able to increase its property tax levy because it has excess capacity. This is why it is important to view these two metrics together.
Statewide
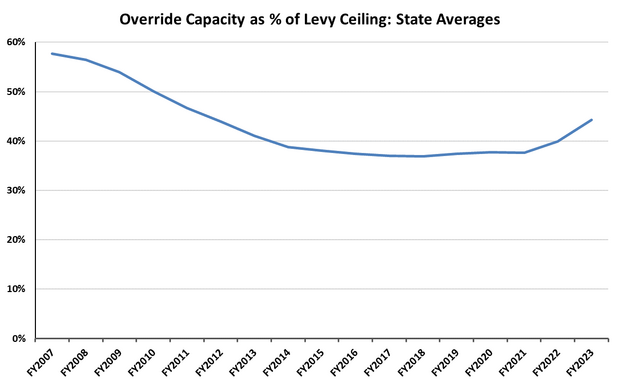
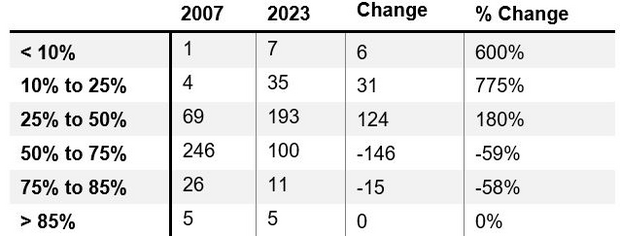
In FY2023 over 300 communities had an override capacity of greater than 25%. Only 42 communities fell below 25% and of those only seven were less than 10%. However, since override capacity is ultimately a function of a community’s assessed property values, wider trends in the real estate market and local economy should be closely monitored. For example, looking back to fiscal 2007, the period before the great recession and housing crisis, provides a good point of comparison relative to today’s values.
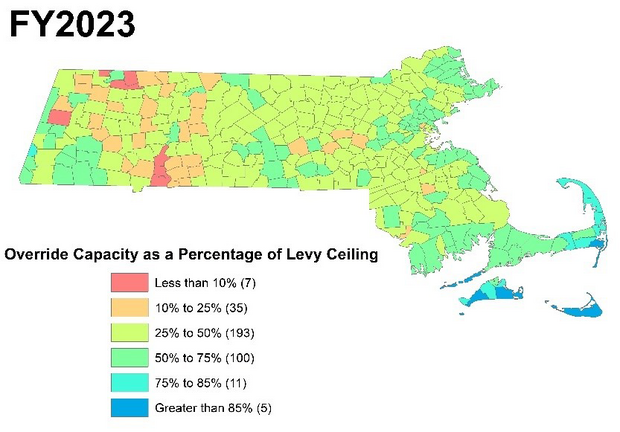
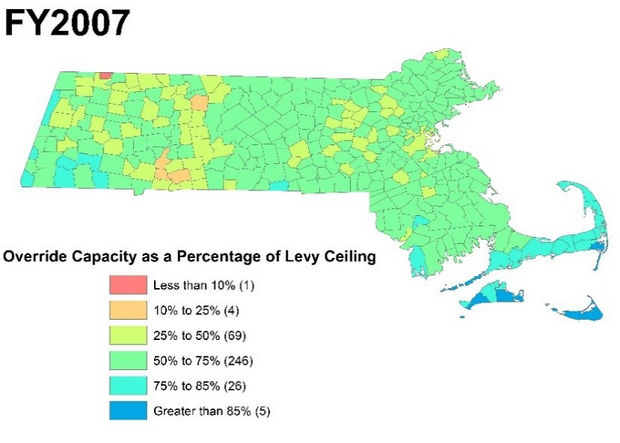
As the maps illustrate, there is a growing number of communities whose override capacity as a percentage of levy ceiling has declined since fiscal year 2007. In FY2007, 346 communities had greater than 25% capacity, while only five fell below 25%. The table below depicts the number and percentage change in override capacity for communities between 2007 to today.
Cities and towns should include this metric in their tracking of their financial indicators and fiscal health. You can view your community’s override capacity and levy information on the DLS Dashboard. In addition, you can view the relationship between override capacity and excess capacity on the DLS Municipal Financial Self-Assessment. Visit trainings and resources on Proposition 2½ and levy calculations for more information.
The DLS Financial Management Resource Bureau (FMRB) provides tailored consultative services to municipalities across the state. Articles in this series highlight a particular financial management best practice that we frequently recommend.
Helpful Resources
City & Town is brought to you by:
Editor: Dan Bertrand
Editorial Board: Tracy Callahan, Sean Cronin, Janie Dretler, Jessica Ferry, Christopher Ketchen, Paula King, Jen McAllister and Tony Rassias
| Date published: | October 19, 2023 |
|---|