MA DMF Trawl Survey
The trawl survey started in 1978 and uses a large net that is towed on the seafloor behind a 72-foot research vessel. Tow locations are randomly selected in state waters before each survey. The trawl survey is the primary survey used in coastwide horseshoe crab stock assessments. The spring survey south of Cape Cod has shown a strong increasing trend for more than a decade (Figure 1), and had the highest density of female crabs in the survey’s history in 2025. The fall survey south of Cape Cod is showing a stable trend for males and females. Trends north of Cape Cod are more variable (Figure 2). The survey is showing an increasing trend over the last 15 years for spring females and fall males. Fall females were showing an increasing trend but have moderated to near the time series median over the last five years. Male crabs are infrequently caught in the spring survey north of Cape Cod. Overall, trawl survey results were positive in 2025, as all data points for each region, season, and sex were above their respective time series medians.
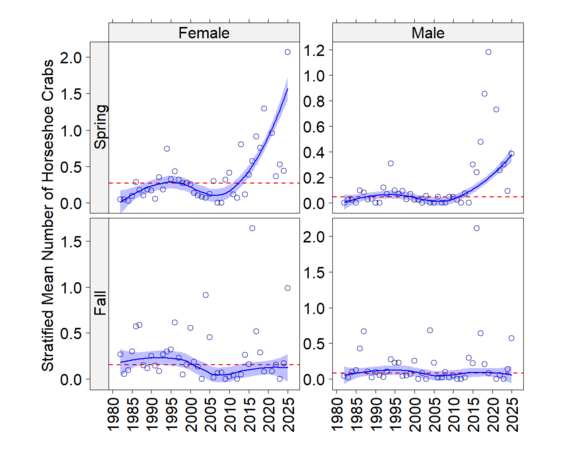
Figure 1. Abundance trends for horseshoe crabs by season and sex for the survey region south of Cape Cod from the MA DMF trawl survey. There are four boxes, the upper boxes are female and male data, respectively, from the spring survey, the lower boxes are female and male data, respectively, from the fall survey. The red dashed line in each panel is the median for that data set. Circles are the average number of crabs caught per tow for each year. The thin blue line is a LOESS smoother fit to the data as a trend line. The blue shaded area around the trend line is the trend line’s confidence interval. The survey shows a strong increasing trend in horseshoe crab abundance for both sexes in the spring, and a stable trend for both sexes in the fall.
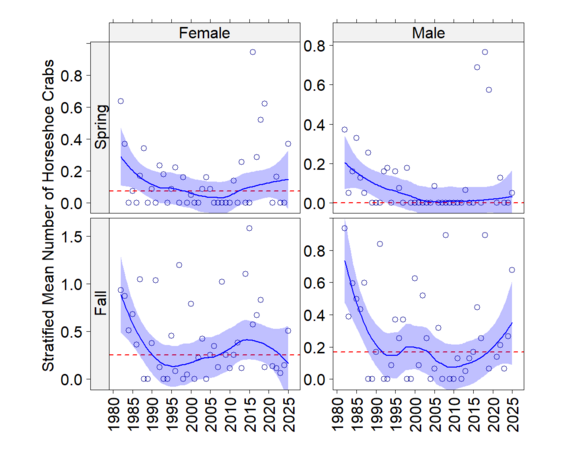
Figure 2. Abundance trends for horseshoe crabs by season and sex for the survey region north of Cape Cod from the MA DMF trawl survey. There are four boxes, the upper boxes are female and male data, respectively, from the spring survey, the lower boxes are female and male data, respectively, from the fall survey. The red dashed line in each panel is the median for that data set. Circles are the average number of crabs caught per tow for each year. The thin blue line is a LOESS smoother fit to the data as a trend line. The blue shaded area around the trend line is the trend line’s confidence interval. The survey shows varying trends. The fall survey has high variability. All 2025 data points were above time series medians.
Massachusetts Horseshoe Crab Spawning Beach Survey
The Massachusetts Horseshoe Crab Spawning Beach Survey started in 2008 and is dependent on volunteers and volunteer organizations to conduct surveys. Surveys are conducted two days prior, the day of, and two days after the new and full moons of May and June. Most beaches are surveyed during day and nighttime high tides. This is a fixed station survey which currently monitors the number of male and female crabs spawning at 16 locations, mostly on the Cape and Islands.
In 2025, 71% of surveys had above normal numbers of female horseshoe crabs (Table 1). Long-term trends are also positive. Over the last 15 years, 71% of surveys show an increasing trend and 90% of the surveys have an increasing trend over the last 10 years. Most commercial harvest of horseshoe crabs in Massachusetts comes from Nantucket Sound, yet all 15 and 10-year trends in this region are increasing. Two of the three outer Cape Cod sites are in Pleasant Bay, which has a 50-year history of biomedical harvest. All three outer Cape Cod sites have increasing 15 and 10-year trends. Over 300 volunteers participated in the survey in 2025.
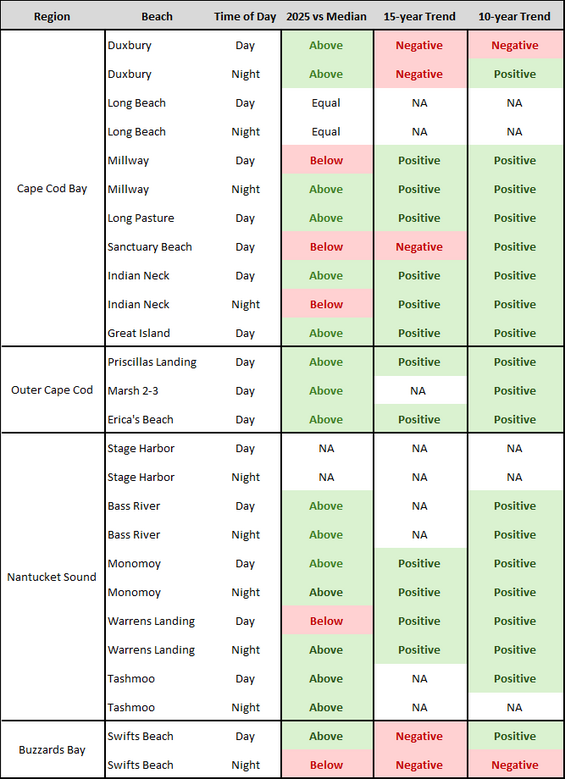
Table 1. Data summary from the Massachusetts Horseshoe Crab Spawning Beach Survey by region, beach, and time of day based on female spawning density. The fourth column shows how the 2025 data point compared to that survey’s time series median. Surveys with data points above the time series median are shaded green. Data points below the time series median are red. Data points equal to or with insufficient data are not shaded. The fifth and sixth columns have 15 and 10-year trends, respectively, based on Mann-Kendall trend analysis. Those with positive trends are shaded in green. Those with negative trends are shaded in red. Those with insufficient data are not shaded. In 2025, 71% of sites were above their time series medians, meaning more crabs were observed than in a normal year. Seventy-one percent of surveys have an increasing trend over the last 15 years, and 90% have increased over the last 10-years.
MA DMF Seine Survey
The Seine Survey started in 1976 but did not consistently count horseshoe crabs until 1984. This fixed station survey is conducted in several embayments along the south side of Cape Cod. The survey net is a 21 foot long, 8-foot-wide seine net that is dragged by two biologists toward the shoreline. There has been an increasing trend in the seine survey for about 20 years (Figure 3). Every data point in the survey has been above the time series median for over a decade.
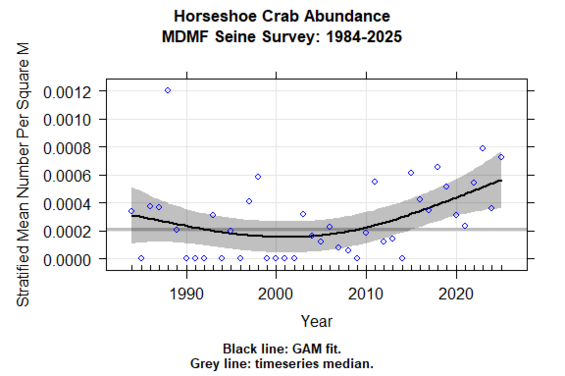
Figure 3. Mean number of horseshoe crabs per square meter from the MA DMF Seine Survey from 1984-2025. Circles are annual data points. The gray line is the time series median. The black line is a trend line from a generalized additive model. The shaded area around the black line is the confidence interval around the trend line. The figure shows an increasing trend over the last 20 years with all data points above the time series median over the last 11 years.