Annual GHG Emissions

As of FY19, overall portfolio emissions were 865,000 MTCO2e, equivalent to a 35% reduction from the FY04 baseline.
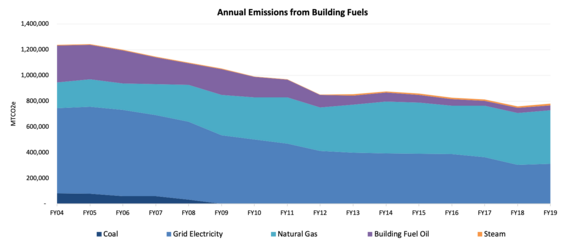
Annual GHG Emissions from Building Fuels

In FY19, compared to the LBE baseline, relative emissions contributions from building fuels have changed significantly. While emissions from electricity have decreased modestly, emissions from fuel oil and coal have been dramatically reduced or eliminated, while emissions from natural gas have more than doubled. These trends are consistent with fuel switching away from dirtier fuels, energy efficiency and installation of natural gas combined heat and power (CHP) and renewable energy.
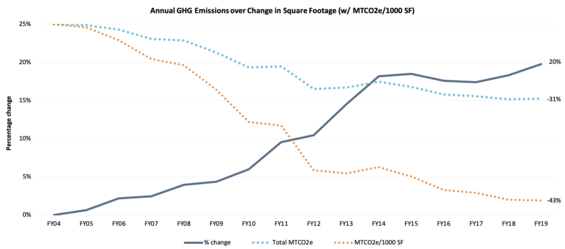
Annual GHG Emissions over Change in Square Footage

Despite an 20 percent increase in square footage (SF) across state facilities, overall GHG emissions have declined 31% and GHG emissions per square foot have decreased 43 percent from the LBE baseline year through Fiscal Year 2019.
*LBE does not track square footage or EUI for 5 of the 49 state partners, due to the nature of energy and facility use at these sites, thus the emission reductions values may vary from overall portfolio emissions.
GHG Emissions by Fuel

| Baseline: | Fiscal Year 2019: |
|---|---|
|
In FY04, grid electricity was by far the largest contributor to total GHG emissions, comprising 50% of total emissions, with fuel oil and coal contributing 22% and 6% of emissions, respectively. Natural gas comprised 15% of the fuel portfolio, while vehicle fuels comprised 6% of total emissions. |
Natural gas contributions to GHG emissions climbed to 48% of total emissions, with the contribution from electricity falling to 36%. Emissions from fuel oil decreased significantly to just 6% of total emissions, while coal was eliminated from the state portfolio entirely. Emissions from vehicle fuels increased lightly to 9%. |