We contacted all of the recipients of the Report on the Status of Child Abuse and Neglect Cases, those being the clerks of the Senate and the House; the Senate and the House Committees on Ways and Means; the Joint Committee on Children, Families and Persons with Disabilities; the Joint Committee on the Judiciary; the Office of the Child Advocate; and the Governor. We inquired about the purpose of the information as provided in the report. The consensus response is summarized as being that the information in the reports may be used for debate, deliberation, and drafting proposed legislation. However, we also received a response stating that the information presented in the reports is not useful for their purposes.
With data presented in multiple formats, the recipients of the reports may be better able to identify trends or to make more informed decisions regarding child welfare.
The current design of the report provides limited information summarizing the total amounts of each reported district attorney office, as summarized in the table below. See Appendix B for more information regarding the current format of the report.
Fiscal Year 2022 Report on the Status of Child Abuse and Neglect Cases
| Abuse and Neglect Referrals* | Referrals Closed without Prosecution** | Criminal Cases Initiated† | Criminal Cases Disposed with Conviction‡ | Criminal Cases Disposed without Conviction§ | |
|---|---|---|---|---|---|
| Total | 12,757|| | 6,150 | 1,878 | 658 | 647 |
* These are recommendations newly made in fiscal 2022 to investigate cases and can come from sources such as police departments, the Office of Child Advocate, or other agencies.
** These are investigations of referrals that were referred either before or during fiscal year 2022 and that did not result in prosecutions; thus, they were closed.
† These are cases that moved forward into prosecution and may include referrals from previous fiscal years.
‡ These are cases for which prosecutions have been concluded, resulting in convictions of the defendants.
§ These are cases for which prosecutions have concluded without convictions.
|| Due to the various stages and lengths of referral investigations and the many stages that cases undergo when proceeding though the courts, it is not possible to reconcile this number to any other figures in the table. Child abuse and neglect cases, from initial referral to final disposition, can take several years to resolve.
During our testing, we reviewed the source data that MDAA summarized in the report. After surveying the recipients of the report, we believe that, while it is not required, it is best practice to include disaggregated information for the benefit of the report recipients. For example, we presented the same fiscal year 2022 data by district in the following table.
| District | Abuse and Neglect Referrals | Referrals Closed without Prosecution | Criminal Cases Initiated | Criminal Cases Disposed with Conviction | Criminal Cases Disposed without Conviction | Percentage of Cases Disposed with Conviction** | Percentage of Cases Disposed without Conviction† |
|---|---|---|---|---|---|---|---|
| Norfolk | 2,244 | 777 | 689 | 91 | 105 | 13% | 15% |
| Bristol | 1,791 | 716 | 275 | 113 | 163 | 41% | 59% |
| Essex | 2,060 | 512 | 232 | 128 | 78 | 55% | 34% |
| Worcester | 1,762 | 1,579 | 215 | 78 | 159 | 36% | 74% |
| Hampden | 1,116 | 371 | 180 | 111 | 71 | 62% | 39% |
| Suffolk | 1,700 | 1,133 | 102 | 19 | 5 | 19% | 5% |
| Cape and Islands | 251 | 162 | 89 | 74 | 15 | 83% | 17% |
| Plymouth | 1,088 | 483 | 56 | 36 | 38 | 64% | 68% |
| Berkshire | 745 | 417 | 40 | 8 | 13 | 20% | 33% |
| Middlesex* | |||||||
| Northwestern* | |||||||
| Total | 12,757 | 6,150 | 1,878 | 658 | 647 |
* The fiscal year 2022 report did not contain information for this agency.
** This column represents the percentage of initiated cases that were disposed with conviction during fiscal year 2022. These numbers may include initiated cases that have been ongoing from previous fiscal years.
† This column represents the percentage of initiated cases that were disposed without conviction during fiscal year 2022. These numbers may include initiated cases that have been ongoing from previous fiscal years.
Comparison of Criminal Cases Initiated and Disposed
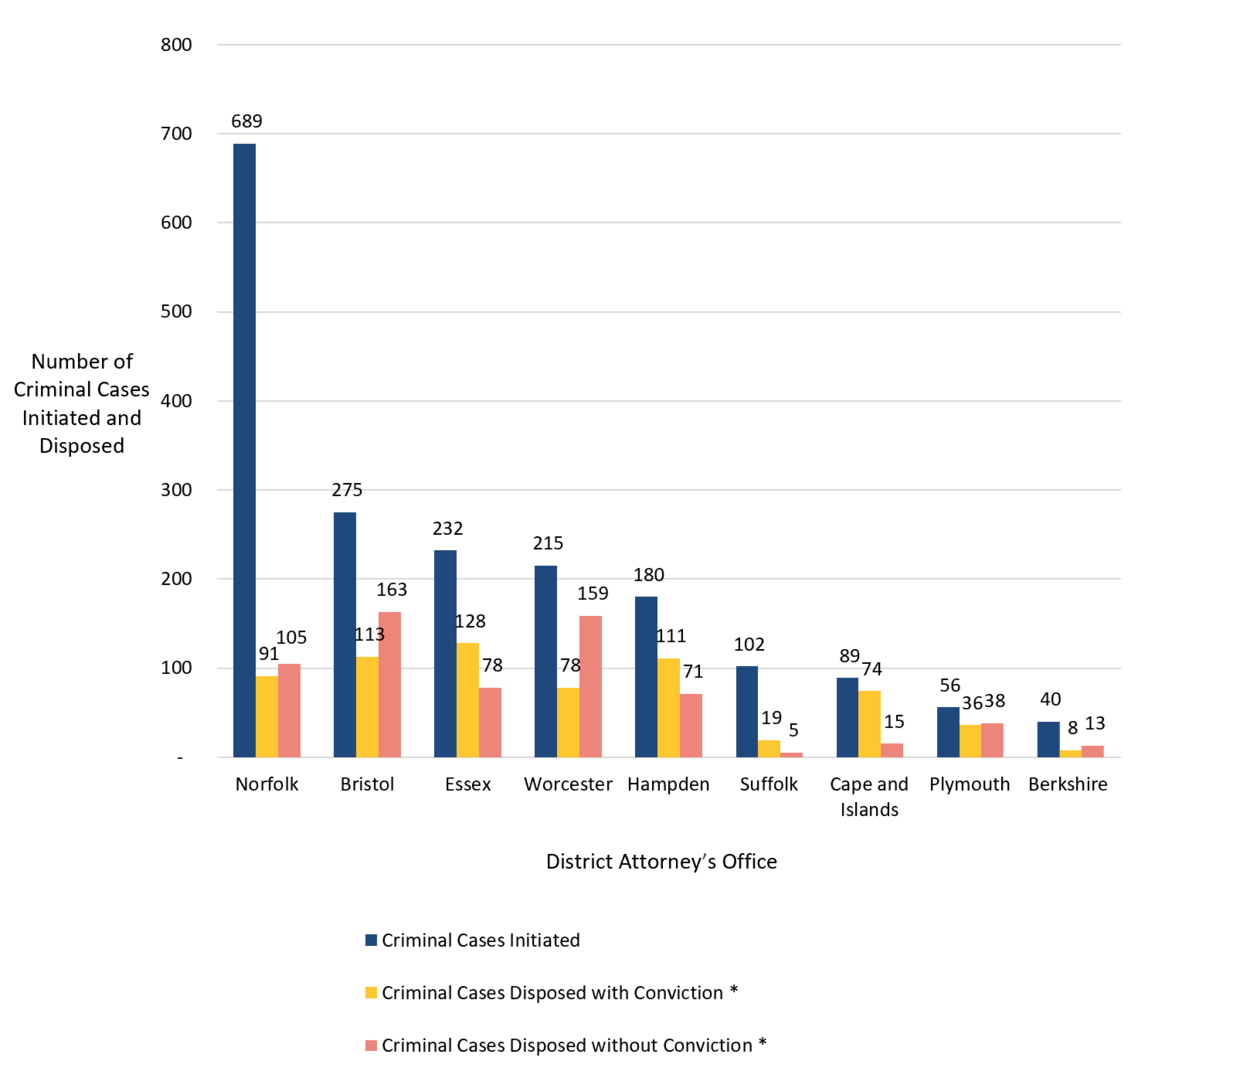
* Disposed cases may include initiated cases that have been ongoing from previous fiscal years.
Although MDAA is only required to report information that is specified in Section 20D of Chapter 12 of the Massachusetts General Laws, we asked report users questions regarding their use of the reports. Their responses indicated that the mandated recipients of the report could be better served with more detailed information.
We recommend that MDAA contact each recipient of the Report on the Status of Child Abuse and Neglect Cases to determine each recipient’s needs and how they use the information. MDAA should then work with each recipient to create a report template which provides information that is relevant and more useful to all of the report recipients.
| Date published: | November 17, 2025 |
|---|