Overview

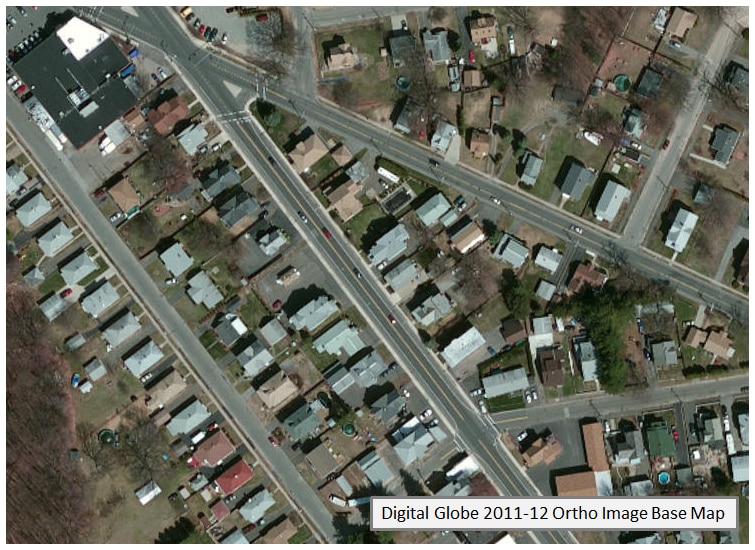
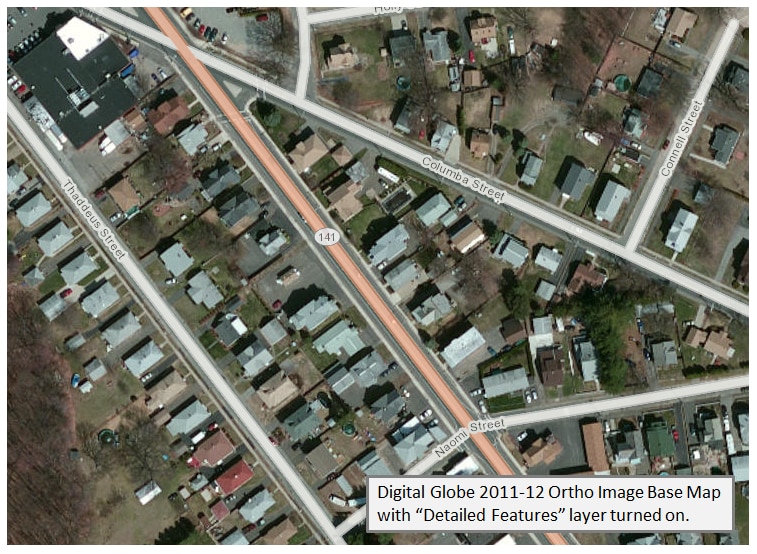
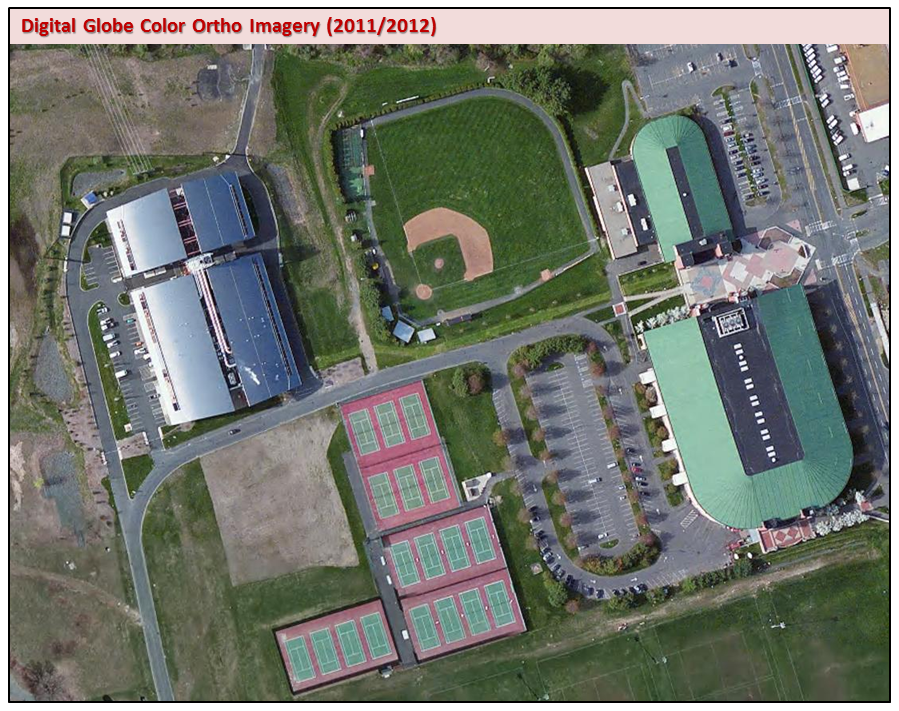
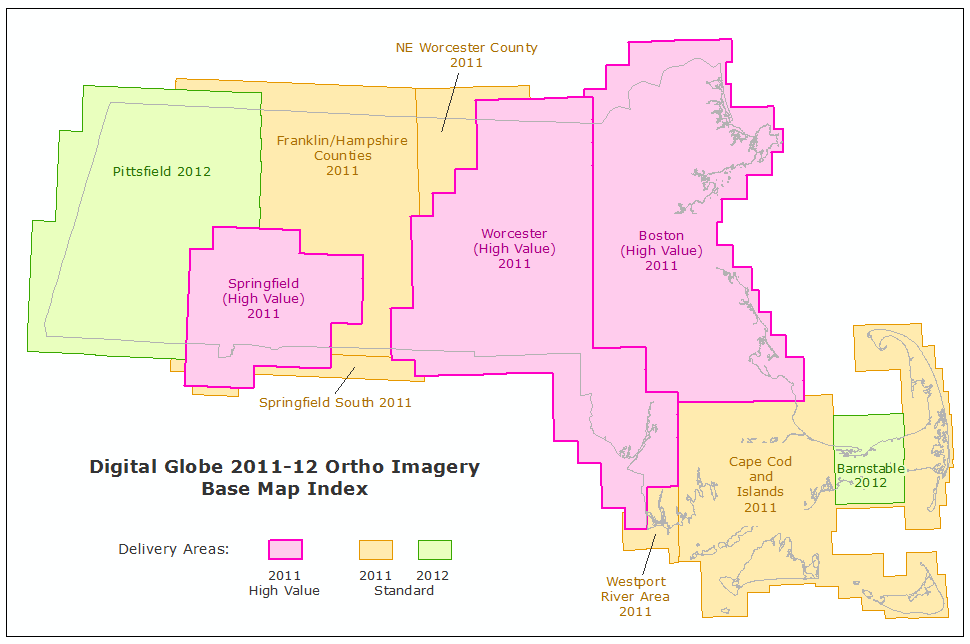
The Digital Globe 2011/2012 color orthoimagery, available as a base map in MassMapper and through ArcGIS Online, contains visible color, 30-centimeter pixel resolution image data from Digital Globe captured in spring 2011 and spring 2012. Imagery was acquired statewide in spring 2011 in nine delivery areas. In Spring 2012, Berkshire County (the "Pittsfield" delivery area) and the town of Barnstable were re-flown, and the newer data are used in the imagery base map for these two areas (as shown on the index below).
Image acquisition consisted of "high value" and "standard" data (described in detail below), with the high value areas complying with more stringent standards. MassGIS created a seamless statewide image layer such that the High Value imagery draws atop any Standard imagery where the areas overlap.
The image base map layer was cached (pre-rendered into a "tileset" of multiple image tiles best suited for display at a range of map scales) for the Web using ArcGIS 10.3. The caching process greatly speeds the display of the imagery. The tileset is hosted at MassGIS' ArcGIS Online organizational account.
Accessing Online
MassMapper: add it to your map as an active data layer in the table of contents, select Images > Aerial Photos (Ortho Imagery) > 2011-2012 Digital Globe Imagery from the Available Data Layers menu.
ArcMap: To display the imagery in ArcMap, go to File > Add Data > Add Data from ArcGIS Online... and search "MassGIS 2011". Click 'Add' in the item "Massachusetts 2011-2012 Digital Globe Ortho Imagery". Access the REST endpoint for the 2011-2012 aerial imagery data. Also see the ArcGIS Online item details page.
Disclaimer
MassGIS does not own this imagery. It is licensed from Digital Globe. MassGIS cannot distribute the image files to the public.
When displayed, the following disclaimer must be included:
"©Digital Globe, Inc. All Rights Reserved".

Imagery Metadata

The imagery was part of Digital Globe's Advanced Ortho Aerial Program “Precision Aerial” high-resolution orthomosaics. These data serve as a high quality base map for Geographic Information Systems (GIS) or other applications that can display or analyze digital orthorectified imagery. Potential uses include asset identification, heads-up digitization, feature extraction, visual analysis, or any application that requires or benefits from a large area or regional orthomosaic imagery product.
These images were orthorectified using a digital elevation model gridded to the UTM projection and WGS84 datum, a set of GPS surveyed ground control points, a set of Airborne GPS measurements for each photo station, and a set of images acquired with a Vexcel-UCG Digital Camera, covering the area to be processed into digital orthoimagery.
All imagery was processed so that bright areas are not oversaturated, and shadow areas are not totally black. In addition, all imagery was color balanced across seam lines within each delivery area. Differences in color and brightness, however, are noticeable from one delivery area to another.
Three areas of the state, as shown in the index map at right, are considered "High Value Areas", which have stricter specifications when compared to the rest of the state, called "Standard Block Areas."
The following table outlines the different production specifications between the High Value and Standard Block imagery sets:
| Type | High Value Areas | Standard Block Areas |
|---|---|---|
| Circular error at a 90% confidence level (CE90)1 | 2.7 m | 4.1 m |
| Radial Accuracy 95% confidence (NSSDA) | 10 ft | 15 ft |
| Equivalent RMSE in X and Y | 4 ft | 6 ft |
| Road Shear | < 1.5 m | < 3.0 m |
| Leaf-off | Yes | Some leaf-out |
| Minimum sun elevation angle | 30° | 20° |
| Cloud Cover | < 0.1 % | < 0.5 % |
| Cloud Shadow | < 0.5 % | < 2 % |
| Haze | < 0.1 % | < 2 % |
| Smoke | < 0.5 % | < 0.5 % |
| Standing Water | < 0.1 % | < 0.5 % |
| Snow | < 0.5 % | < 1 % |
Values for Delivered Data:
| High Value Areas | Sun Elev. | Acquisition Dates |
|---|---|---|
| Boston | 31°-54° | 2011-03-30, 04-08 |
| Worcester | 33°-56° | 2011-04-08, 04-09 |
| Springfield | 42°-59° | 2011-04-15, 04-18 |
| Standard Blocks | Sun Elev. | Acquisition Dates |
|---|---|---|
| Cape Cod and Islands | 22°-61° | 2011-03-30, 04-08, 04-18, 04-21, 04-29, 05-01, 10-08 |
| Westport River Area | 33°-61° | 2011-03-30, 04-08, 04-09, 04-21, 04-29, 05-01 |
| Springfield South | 26°-66° | 2011-04-09, 4-15, 4-18, 5-1, 5-12 |
| NE Worcester County | 31°-56° | 2011-03-30, 04-08, 04-09, 05-01 |
| Franklin/Hampshire Counties | 26°-59° | 2011-04-09, 04-15, 04-18, 05-01, 05-06, 05-12 |
| Pittsfield (refresh) | 39°-51° | 2012-03-27 |
| Barnstable (refresh) | 30°-34° | 2012-03-27 |
How horizontal accuracy is determined
Numerous image-identifiable targets are carefully surveyed to a very high level of accuracy, and the positions of the targets in the imagery are also measured.
RMSEx = SQRT(SUM(ximg –xmeas)2/n)
RMSEy = SQRT (SUM(ximg –xmeas)2/n)
Where the (ximg, yimg) are image-derived coordinates of the targets, and (xmeas, ymeas) are the measured locations of the targets in the field, and n is the number of points used.
RMSEr = SQRT ((RMSEx)2 + (RMSEy)2)
1CE90 = 1.5175 × RMSEr