Downloads
Overview
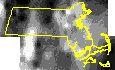
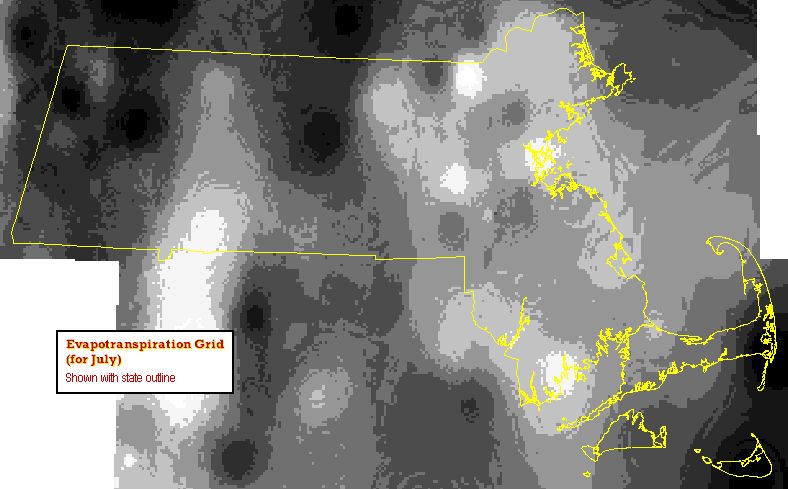
These two datasets for Massachusetts model average monthly reference grass evapotranspiration (Et) and potential evaporation (Ep) from open water bodies. Both processes may be modeled using an energy budget accounting approach that was developed by Penman (1948) for Ep and referred to as the Penman Equation which was later modified by Monteith (1965) for Et, and referred to as the Penman-Monteith Equation. These models require knowledge of far too many variables for use in regional analyses. Neil M. Fennessey and Richard M. Vogel (1996) developed a method that accurately represents the Penman Equation and Penman-Monteith Equation results using only mean monthly air temperature, site longitude and elevation. The average monthly air temperature values used in the models were from NOAA data collected from 1951 to 1980. Fennessey et al. (1998) used this method to create two datasets: the average monthly reference grass (12 cm tall) evapotranspiration and potential evaporation from open water bodies (streams, lakes and ponds) for New York, New Jersey, Pennsylvania and all of the New England states.
The reference for these datasets are:
Fennessey, N.M., and R. M. Vogel, Regional Models of Potential Evaporation and Reference Evapotranspiration for the Northeast USA , Journal of Hydrology, Vol. 184, pp. 337-354, 1996.
Fennessey, N.M., “Estimating Average Monthly Lake Evaporation in the Northeast United States”, J. of American Water Resources Association, Vol. 36, pp. 759-769, 2000.
Fennessey, N. M., J. Dyment, K. Burlingame, J. Quintal, D. Walsh and N. Gianferante. “Monthly Maps of Mean Daily Free Surface Evaporation and Reference Evapotranspiration, Volumes 1-9”, UMass-Dartmouth Department of Civil and Environmental Engineering, Hydrology and Water Resources Group Publication, October 1998.
Monteith, J.L., (1965), “Evaporation and the environment. The state and movement of water in living organisms”. Symposium of the Society of Experimental Biologists, XIX, 1965
Penman, H.L., (1948), “Natural evaporation from open water, bare soil and grass”, Proc. of the Royal Society of London, Ser. A, 193, pp. 120-148, 1948.
MassGIS stores the data in two series of statewide ArcSDE raster datasets. The 12 average monthly reference crop evapotranspiration rasters are named ET_<month>_G and the 12 potential evaporation from open water bodies rasters are named EP_<month>_G, where <month> is the month number, 1 to 12.
The data are distributed as tiff image files.
Production
Text files delivered by Neil M. Fennessey to MassGIS were generated using a 30 degree arc-second digital elevation model; NOAA Summary-of-the-Day period-of-record mean monthly temperature data were interpolated to each grid square using an inverse-distance squared interpolation as described by Fennessey et al. (1998). This work was funded by the U.S. Geological Survey Water Resources Institute Program grant number 1434-HQ-96-GR-02676. MassGIS converted these text files to point shapefiles. These shapefiles were projected from geographic coordinates to MA Stateplane Mainland (NAD83 meters) and these projected shapefiles were then converted to 1000-meter grids. The grids were loaded into MassGIS' Oracle-based ArcSDE geodatabase.
Attributes
The unit of the value represented in each cell is millimeters per day.
Maintenance
There will be no updates to these datasets.