Downloads
Overview

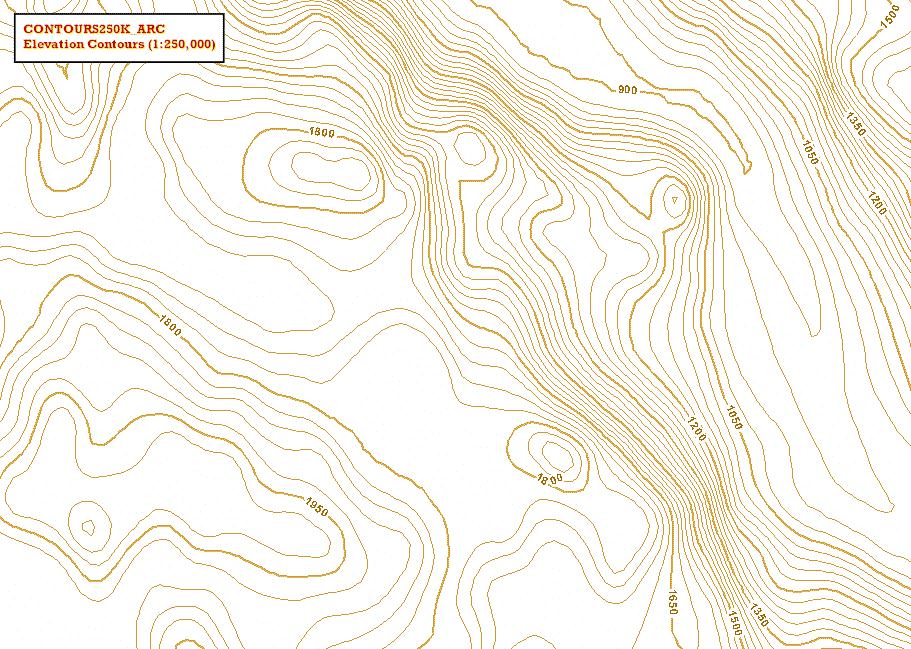
The 1:250,000 Hypsography datalayer contains elevation contours at a 30-foot interval. Available for the entire state, it was created by MassGIS from Defense Mapping Agency (now the National Imagery and Mapping Agency) data as reformatted by the USGS National Mapping Division. The ArcSDE and shapefile layers are named CONTOURS250K_ARC.
NOTE: It is essential that these data be used at a regional scale consistent with the scale of the source data which is 1:250,000. Not all the contours will line up with such MassGIS data layers as the shoreline, the hydrography or the basin lines. Caution should be exercised in producing graphic output. Some significant features are missing from the original data. For more detailed elevation data, please see the Elevation Contours (1:5,000) datalayer description.
Production
Manuscript
The source data are the digital elevation models created by the Defense Mapping Agency at a nominal 1:250,000 scale. The original digital elevation files consist of a one degree square array of elevation values at 3 arc-second intervals, (approx. 200 ft.), measured in integer meters. This source data has been classified as level 1 by the USGS, which means that the root mean square error of any sample point is expected to be less than one-half contour interval. In practice, this means that a spot elevation interpolated from contours plotted at an appropriate interval (not less than 20 ft.) would probably be within 30 ft. of its 'true' elevation. Note that in areas where the elevation value is most rapidly changing the vertical error is likely to be larger, but the horizontal distance to a point at the elevation shown will tend to remain the same.
Methodology
The original files were too large to process using the Arc/INFO DEMLATTICE command, so they were first broken up into smaller files and formatted as Arc/INFO .svf files using FORTRAN routines. Arc/INFO lattice files were then created using theGRIDLATTICE command and a low-pass FILTER was run on them to 'smooth' the data. The LATTICEOPERATE command was used to convert from meters into feet. Contour coverages were created from the lattice files using a contour interval of 30 feet, which was consistent with the input scale of the data. The contour coverages were then PROJECTED into state plane feet, and rounded off to feet.
Attributes
This datalayer has an arc attribute table with the field CONTOUR_FT, which stores the elevation above sea level in feet. The INDEX_ARC attribute may be used for displaying and labelling index arcs (see image above); Arcs are coded 'Y' where CONTOUR_FT is an even multiple of 150; all others are coded 'N'.