Downloads
Download these images (MrSID format):
From the table below
ArcGIS 9.0/9.1 layer files (see README in zip)
Download the index layer (Shapefile)
Overview

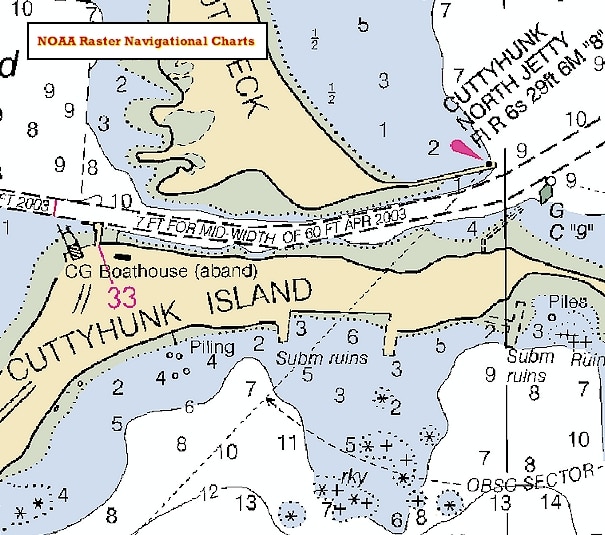
NOAA nautical charts are a graphic representation of a maritime area and adjacent coastal regions. Depending on the scale of the chart, it may show depths of water and heights of land (topographic map), natural features of the seabed, details of the coastline, navigational hazards, locations man-made aids to navigation, information on tides and currents, local details of the Earth's magnetic field, and man-made structures such as harbors, buildings and bridges.
In the United States, all official nautical paper charts produced by NOAA's Office of Coast Survey (OCS) are available in raster format. A fundamental tool of marine navigation, NOAA's Raster Navigational Charts (NOAA RNCs) are produced by scanning at high resolution the original color separates, which are used to print the paper charts. NOAA adds to the digital raster file such features as data describing the chart, its datum, projection, and its geo-reference. Geo-referencing enables a computer-based navigation system that is connected to a GPS to locate and display on the chart image on screen the vessel's exact position.
DISCLAIMER: It is important to note that these images alone should not be used for navigational purposes. Because of potential updates and limitations on scale, the NOAA Raster Navigational Chart data distributed by MassGIS should be used primarily as a backdrop display, for plotting vector data, and for interpretation and analysis. Mariners should always consult Coast Pilot and local port authorities and harbormasters and check water and weather conditions. MassGIS, the Commonwealth of Massachusetts, and the Executive Office of Energy and Environmental Affairs do not assume responsibility for the improper use of these data.
In ArcSDE the 68 chart images are named NOAA_<chart #>_<quantity>, in the NOAA schema. The "chart #" is the five-digit number assigned by NOAA. Following the chart number and an underscore character is a number indicating the quantity of images produced from each RNC (some maps have one or more insets and/or sections of the main map, and each is included as its own image). Two additional images, with a "_TC" suffix, are not charts but digital versions of tide charts and other textual information for the small craft operator.
A vector index layer was created from the footprints of each image in ArcGIS. This layer, named NOAA_INDEX_POLY in the NOAA schema in ArcSDE, may be used to reference the location of each chart.
Please note that the August 2008 release of these images replaces the older, less spatially accurate images produced by MassGIS by scanning paper copies of NOAA Nautical Charts.
Production
MassGIS received the images from NOAA, via the Massachusetts Office of Coastal Zone Management. MassGIS imported the rasters into its ArcSDE database and projected each to the NAD83 Mass. State Plane Mainland Meters coordinate system. The images are otherwise unchanged. Learn about the NOAA charts. Note that the new images include the "collars" -- the borders and other non-data areas (text, etc.) that appear on each chart. In the previous set MassGIS had clipped off the collars, which on the new images will obscure parts of adjacent or overlapping charts. See the "Displaying the Images" section below for more details.
To produce the index layer, the ArcGIS Raster to Polygon tool was used to create a polygon representing the outline of each chart image. All the polygons were then merged into a single polygon feature class.
The following table lists the image number, chart title and original paper map scale and edition date (last updated by NOAA) for all the images in this layer. Click on an Image No. link to download a zipped MrSID image file.
| Image No. | Chart Title | Scale | Edition Date |
|---|---|---|---|
| 13006_1 | West Quoddy Head To New York | 675000 | 5/1/2007 |
| 13009_1 | Gulf Of Maine And Georges Bank | 500000 | 5/1/2007 |
| 13200_1 | Georges Bank And Nantucket Shoals | 400000 | 5/1/2007 |
| 13203_1 | Georges Bank Western Part | 220000 | 8/14/1999 |
| 13204_1 | Georges Bank Eastern Part | 220000 | 8/14/1999 |
| 13218_1 | Martha's Vineyard to Block Island | 80000 | 2/16/2008 |
| 13221_1 | Narragansett Bay | 50000 | 6/17/2006 |
| 13221_2_tc | Additional information (tide charts, etc.) for the small craft operator | -- | 6/17/2006 |
| 13224_1 | Providence River and Head of Narragansett Bay | 20000 | 11/1/2006 |
| 13224_2 | Seekonk River, Cold Spring Point to Pawtucket | 20000 | 11/1/2006 |
| 13226_1 | Mount Hope Bay | 20000 | 1/1/2004 |
| 13226_2 | Continuation of Taunton River | 20000 | 1/1/2004 |
| 13227_1 | Fall River Harbor | 10000 | 3/1/2006 |
| 13227_2 | State Pier | 2500 | 3/1/2006 |
| 13228_1 | Westport River And Approaches | 20000 | 5/17/1997 |
| 13229_1 | South Coast of Cape Cod and Buzzards Bay (Barnstable-Chatham) | 40000 | 12/18/2004 |
| 13229_3 | South Coast of Cape Cod and Buzzards Bay (Inset-Hyannis Harbor) | 20000 | 12/18/2004 |
| 13229_4 | South Coast of Cape Cod and Buzzards Bay (Gosnold-Barnstable) | 40000 | 12/18/2004 |
| 13229_6 | South Coast of Cape Cod and Buzzards Bay (Inset-Woods Hole) | 5000 | 12/18/2004 |
| 13229_7 | South Coast of Cape Cod and Buzzards Bay (Inset-Robinsons Hole) | 12000 | 12/18/2004 |
| 13229_8 | South Coast of Cape Cod and Buzzards Bay (Inset-Cuttyhunk Harbor) | 12000 | 12/18/2004 |
| 13229_9 | South Coast of Cape Cod and Buzzards Bay (Gosnold) | 40000 | 12/18/2004 |
| 13229_10 | South Coast of Cape Cod and Buzzards Bay (Dartmouth-Falmouth) | 40000 | 12/18/2004 |
| 13229_11 | South Coast of Cape Cod and Buzzards Bay (N Buzz Bay) | 40000 | 12/18/2004 |
| 13229_12 | South Coast of Cape Cod and Buzzards Bay (New Bedford Harbor) | 20000 | 12/18/2004 |
| 13229_13 | South Coast of Cape Cod and Buzzards Bay (Cape Cod Canal) | 40000 | 12/18/2004 |
| 13229_14 | South Coast of Cape Cod and Buzzards Bay (Inset-Prince Cove) | Unknown | 12/18/2004 |
| 13229_15_tc | Tide prediction chart | -- | 12/18/2004 |
| 13230_1 | Buzzards Bay | 40000 | 10/1/2005 |
| 13230_2 | Quicks Hole | 20000 | 10/1/2005 |
| 13232_1 | New Bedford Harbor and Approaches | 20000 | 6/30/2001 |
| 13232_2 | Continuation of Apponagansett Bay | 20000 | 6/30/2001 |
| 13233_1 | Marthas Vineyard | 40000 | 9/1/2005 |
| 13233_2 | Menemsha Pond | 20000 | 9/1/2005 |
| 13235_1 | Woods Hole | 5000 | 4/1/2004 |
| 13236_1 | Cape Cod Channel And Approaches | 20000 | 3/1/2006 |
| 13236_2 | Cape Cod Channel And Approaches | 20000 | 3/1/2006 |
| 13237_1 | Nantucket Sound And Approaches | 80000 | 3/1/2007 |
| 13238_1 | Marthas Vineyard - Eastern Part | 20000 | 8/1/2007 |
| 13238_2 | Oak Bluffs Harbor | 10000 | 8/1/2007 |
| 13238_4 | Edgartown Harbor | 10000 | 8/1/2007 |
| 13241_1 | Nantucket Island | 40000 | 11/1/2005 |
| 13242_1 | Nantucket Harbor | 10000 | 5/26/2001 |
| 13244_1 | Eastern Entrance To Nantucket Sound | 40000 | 7/1/2005 |
| 13246_1 | Cape Cod Bay | 80000 | 12/1/2006 |
| 13248_1 | Chatham Harbor And Pleasant Bay | 20000 | 3/17/2001 |
| 13249_1 | Provincetown Harbor | 20000 | 4/1/2007 |
| 13250_1 | Wellfleet Harbor | 40000 | 10/13/2001 |
| 13251_1 | Barnstable Harbor | 20000 | 9/1/2004 |
| 13253_1 | Harbors of Plymouth, Kingston And Duxbury | 20000 | 7/1/2005 |
| 13260_1 | Bay Of Fundy To Cape Cod | 378838 | 7/1/2005 |
| 13267_1 | Massachusetts Bay | 80000 | 7/1/2005 |
| 13267_2 | North River | 20000 | 7/1/2005 |
| 13269_1 | Cohasset And Scituate Harbors | 10000 | 2/1/2006 |
| 13270_1 | Boston Harbor | 25000 | 6/1/2006 |
| 13272_1 | Boston Inner Harbor | 10000 | 10/1/2004 |
| 13272_2 | Mystic River Extension | 10000 | 10/1/2004 |
| 13274_1 | Portsmouth Harbor to Boston Harbor (Hampton-Rockport) | 40000 | 6/1/2007 |
| 13274_2 | Portsmouth Harbor to Boston Harbor (NH coast) | 40000 | 6/1/2007 |
| 13274_3 | Merrimack River Extension | 80000 | 6/1/2007 |
| 13274_4 | Merrimack River Extension | 80000 | 6/1/2007 |
| 13274_5 | Portsmouth Harbor to Boston Harbor (Rockport-Boston) | 40000 | 6/1/2007 |
| 13275_1 | Salem and Lynn Harbors | 25000 | 6/23/2006 |
| 13275_2 | Manchester Harbor | 10000 | 6/23/2006 |
| 13276_1 | Salem, Marblehead and Beverly Harbors | 10000 | 7/1/2003 |
| 13278_1 | Portsmouth To Cape Ann | 80000 | 6/1/2005 |
| 13278_2 | Hampton Harbor | 30000 | 6/1/2005 |
| 13279_1 | Ipswich Bay To Gloucester Harbor | 20000 | 2/1/2007 |
| 13281_1 | Gloucester Harbor And Annisquam River | 10000 | 2/1/2007 |
| 13282_1 | Newburyport Harbor and Plum Island Sound | 20000 | 4/1/2003 |
Disclaimer
From the NOAA RNC User Agreement:
Limitations on Use: NOAA RNCs™ may be redistributed, but redistributed NOAA RNCs™ are NOT considered official NOAA RNCs™, and do not meet federal chart carriage regulations for regulated vessels. This official status attends only to the original downloaded files. At a future date, NOAA intends to establish a program under which distributors may be certified to redistribute NOAA RNCs™ such that they will retain their official status and meet chart carriage regulations.
Displaying the images
As noted above, because these images include the map collars, displaying adjacent or overlapping charts will not be seamless. With the geodatabase version in ArcMap, choosing to display "nodata" and Color Index value 1 (white) as 'No Color' will minimize the effect of the collars. In the MrSID files,black "nodata" areas appear around the edges; displaying "nodata" as 'No Color' will partially minimize these areas. Also, some ArcMap users may want to choose to resample during display using Bilinear Interpolation for a smoother, more readable appearance (set this in the image layer's properties Display tab). The layer files available for download include the bilinear resampling and layer titles as listed in the table above.
Additional References
When using these NOAA Chart images, it may be helpful to refer to NOAA's "Office of Coast Survey" site, which contains a multitude of links, including user manuals, map symbol descriptions and more.
MassGIS does not sell or distribute paper copies of the NOAA Nautical charts. NOAA offers on-demand printed paper charts. Such maps also may be viewed at some major libraries.
For charts on the web, see NOAA's On-Line Chart Locator.