Overview of the Financial Climate for Municipalities in Massachusetts

This section reviews factors impacting municipal finances.

Table of Contents

Overview

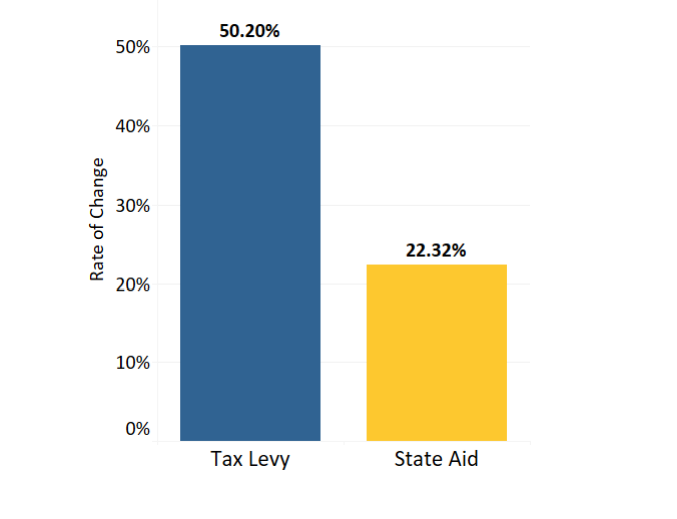
Communities across Massachusetts receive most of their revenue from the municipal tax levy,30state aid,31 and local receipts.32 In the last 10 fiscal years, municipal revenues increased by $9.18 billion, or 42%.33 Between fiscal years (FYs) 2019 and 2020, municipal revenue grew by $1.2 billion, or 4.1%.34 However, revenue trends highlight that cities and towns continue to be reliant on higher property tax levies and increased local receipts to fund their operations.35 Tax levies accounted for 55.33% of total municipal revenue in FY 2010, and state aid accounted for 22.23% of total revenue.36 By FY 2020, tax levies had increased and accounted for 58.41% of total municipal revenue, while the state aid share had decreased and accounted for 19.12% of total municipal revenue.37 Between FY 2010 and FY 2020, tax levies and local receipts increased by 50.2% and 35.3%, respectively, but state aid only increased by 22.3%, as seen in Figure 3.38


Figure 3—Changes in Tax Levy and State Aid Revenues39


Bar chart shows comparison of municipal tax levy and state aid rate of change from FY 2010 to FY 2020.


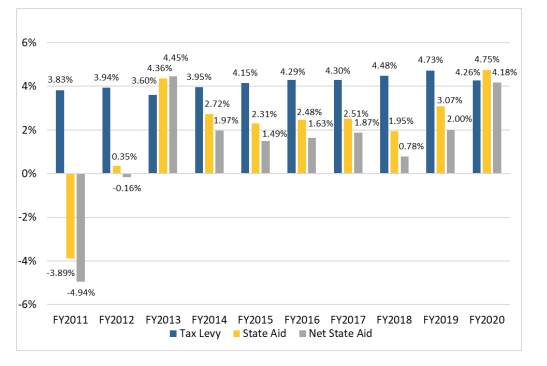
State aid revenues do not show the entire picture of the actual funding that municipalities receive from the Commonwealth. Cities and towns are also charged assessments by the Commonwealth for certain services and programs.40 In FY 2020, municipalities received $5.9 billion in state aid, but were charged $1.1 billion in assessments.41 What municipalities actually received was $4.8 billion in net state aid, representing 16.1% of total municipal revenue. State assessments increased by $497 million, or 82%, between FY 2010 and FY 2020.42 Considering these charges, state aid net of assessments increased by 13.7% during the same period.43 Figure 4 provides a closer look at how these revenues changed in the last decade.


Figure 4—Change in Municipal Revenue, FY 2011 to FY 202044


Bar chart shows municipal funding based on municipal taxes, state aid, and local receipts for fiscal year 2011 through fiscal year 2020.

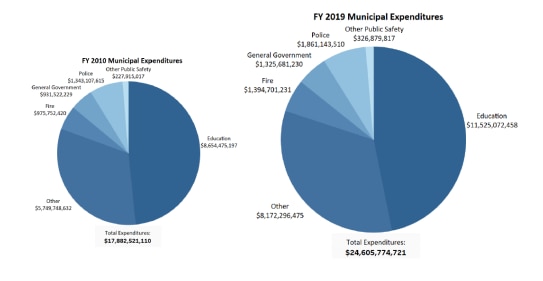
Municipal spending is on the rise as well, particularly for education and public safety, the two largest categories of municipal expenditures.45 Legal requirements imposed by the state, such as minimum levels of school district spending under the Education Reform Act of 1993, 46 account for some of the increases in municipal expenditures.47 Between FY 2010 and FY 2019, total municipal spending increased by 37.6%, or $6.72 billion.48 During this period, education spending increased by 33.2%, or $2.8 billion, while public safety spending increased by 40.1%, or $1 billion.49 In FY 2019, education accounted for 46.8% of total statewide municipal spending, and public safety accounted for 14.6% of total statewide municipal spending, as seen in Figure 5.50

Figure 5—Selected Municipal Expenditures,  FY 2010 vs. FY 201951


Two blue pie charts shown side-by-side. Each reflects the breakdown in municipal spending in 2010 on the left versus 2019 on the right.


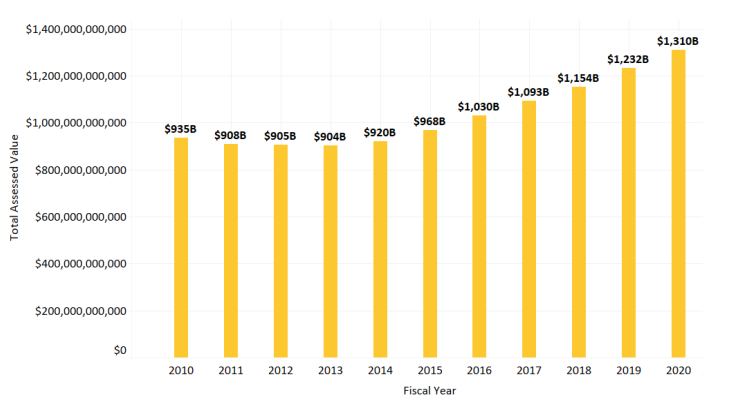
Alongside these increases are the changes to municipal assessed property values, which impact the tax levies of cities and towns.52 The Great Recession and subsequent economic decline in the late 2000s led to decreased property values, but values have recovered to pre-recession levels and are growing rapidly, particularly in the eastern part of the state. Between FY 2010 and FY 2013, assessed values declined by 3.3%, or $30.6 billion.53 The total municipal assessed value reached its lowest level of the 2010s in FY 2013 (approximately $904 billion), due in part to time delays in determining assessments.54 However, values recovered by FY 2016, when the total municipal assessed value reached its highest level since FY 2008. As seen in Figure 6, municipal assessed values continued to rise each year after that and reached $1.31 trillion by FY 2020—a 44.9%, or $405.9 billion, increase since FY 2013.55

Figure 6 – Municipal Assessed Property Values, FY 2010 to FY 202056

Bar chart shows change in municipal property tax assessments from fiscal year 2010 through 2020.


Other events have affected the financial climate of Massachusetts. First, the 2019 coronavirus (COVID-19) pandemic, which hit the state in early 2020, ignited another economic recession, forced individuals into unemployment, and slowed down growth in state aid. The state increased Chapter 70 education aid to localities by over $97 million in FY 2021, yet this was a much smaller increase in funding than in the previous fiscal year (an increase of over $258 million).57 Unrestricted general government aid, on the other hand, was funded at the same level as FY 2020.58 The presence of federal funding, particularly from the Coronavirus Aid, Relief, and Economic Security (CARES) Act, as well as other grants and resources, has aided municipalities and has offset costs that abruptly appeared in the early months of the pandemic.59 State and local budgets will receive a significant boost in federal revenue from the American Rescue Plan Act (ARPA), which was signed into law in March 2021.60  The Commonwealth will receive $5.3 billion in ARPA funding, while municipalities and counties will receive nearly $2 billion and $1.34 billion, respectively.61 It will be years until the impact of ARPA funds is seen, as municipalities and the state have until December 2024 to determine their use and until December 2026 to expend them.62

There is no clear picture of the long-term financial effects of the pandemic during the fiscal years discussed in this report, in part because the pandemic did not impact the state until March 2020—late in the third quarter of FY 2020. However, various financial categories were affected differently by the pandemic-related recession. For example, room-occupancy and meals tax revenue dropped, while property tax revenues remained stable and residential assessed values continued to rise due to continued price increases in the housing market.63 Other taxes, such as sales taxes on retail, alcohol, and recreational marijuana, did not see a significant revenue decline.64

Second, the Student Opportunity Act will provide a much-needed infusion of assistance to cities and towns by increasing state aid by $1.5 billion over a seven-year period.65 The act, signed by the Governor in 2019, will increase school spending in the most disadvantaged school districts and aims to level out disparities seen in comparison to wealthier districts.66 Although the pandemic delayed the distribution of these funds, which was slated to begin in FY 2021, the Legislature acted to boost funding in FY 2022 to remain on track for full funding in upcoming years.67 timing of this state aid will be vital to districts that are facing budget constraints due to COVID-19 pandemic related causes such as reductions in student enrollment.68

30. The tax levy consists of tax revenues that communities raise from real and personal property taxes.

31. State aid (also sometimes referred to as local or intergovernmental aid) consists of funds allocated by the Commonwealth to municipalities to pay for local services. State aid includes, but is not limited to, Chapter 70 (education) funding, school transportation funding, charter-school tuition reimbursement, unrestricted general government aid, veterans’ benefits, state-owned-land reimbursements, urban revitalization funding, and funding for public libraries. The Division of Local Services (DLS) also includes, as part of state aid, reimbursements for school project costs by the Massachusetts School Building Authority, which are listed in municipalities’ tax recapitulations instead of their Cherry Sheets (the recap of local aid and receipts performed by DLS). For the purposes of this report, we are using the Division of Local Services’ definition of state aid, which includes Massachusetts School Building Authority reimbursements. This definition does not include state assessments to municipalities, which we address separately in this narrative.

32. Local receipts are non-property-tax revenues that are generated by municipalities. Local receipts include, but are not limited to, motor-vehicle excise taxes, investment income, occupancy taxes, fees, rentals, and charges.

33. Based on total revenues between fiscal years 2010 and 2020. See also Department of Revenue, Division of Local Services (2021). Revenue by source. https://dlsgateway.dor.state.ma.us/reports/rdPage.aspx?rdReport=RevenueBySource.RBS.RevbySourceMAIN.

34. Id.

35. DLM previously identified this trend in our 2016 statutory fiscal impact report. See Massachusetts Office of the State Auditor, Division of Local Mandates (2016, April 6). Five-year statutory fiscal impact report, at 3.

36. Department of Revenue, Division of Local Services (2021). Revenue by source.

37. Id.

38. Id.

39. Department of Revenue, Division of Local Services. (2021). Revenue by source. https://dlsgateway.dor.state.ma.us/reports/rdPage.aspx?rdReport=RevenueBySource.RBS.RevbySourceMAIN

40. State assessments include, but are not limited to, retired teachers’ health insurance, mosquito control projects, Massachusetts Bay Transportation Authority regional transportation, sending tuition for charter schools, and certain special education services.

41. Division of Local Services. (2021, July 19). Municipal Cherry Sheet Estimates. Retrieved from https://dlsgateway.dor.state.ma.us/reports/rdPage.aspx?rdReport=CherrySheets.CSbyProgMunis.MuniBudgFinal

42. Id.

43. Id.; Department of Revenue, Division of Local Services. (2021). Revenue by source. https://dlsgateway.dor.state.ma.us/reports/rdPage.aspx?rdReport=RevenueBySource.RBS.RevbySourceMAIN.

44. Department of Revenue, Division of Local Services. (2021). Revenue by source. https://dlsgateway.dor.state.ma.us/reports/rdPage.aspx?rdReport=RevenueBySource.RBS.RevbySourceMAIN; Division of Local Services. (2021, July 19). Municipal Cherry Sheet Estimates. Retrieved from https://dlsgateway.dor.state.ma.us/reports/rdPage.aspx?rdReport=CherrySheets.CSbyProgMunis.MuniBudgFinal

45. Department of Revenue, Division of Local Services (2021). General fund - Expenditures. https://dlsgateway.dor.state.ma.us/reports/rdPage.aspx?rdReport=ScheduleA.GenFund_MAIN.

46. St. 1993, c. 71, § 67.

47. Between FY 2010 and FY 2019, the minimum local contribution required for school district spending increased by 19%, or $996,736,825. See also Massachusetts Department of Elementary and Secondary Education. (2021, September 30). Chapter 70 District Profile. Retrieved from https://www.doe.mass.edu/finance/chapter70/profile.xlsx

48.Department of Revenue, Division of Local Services (2021). General fund - Expenditures.

49. Id.

50. Id.

51. Department of Revenue, Division of Local Services (2021). General fund - Expenditures. https://dlsgateway.dor.state.ma.us/reports/rdPage.aspx?rdReport=ScheduleA.GenFund_MAIN.

52. Department of Revenue, Division of Local Services (2021). Assessed values by class. https://dlsgateway.dor.state.ma.us/reports/rdPage.aspx?rdReport=PropertyTaxInformation.AssessedValuesbyClass.assessedvaluesbyclass

53. Id.

54. Id. Assessed property values for FY2013 were determined from data from calendar year 2011 and were determined as of January 1, 2012.

55. Id.

56. Department of Revenue, Division of Local Services. (2021). Assessed values by class. https://dlsgateway.dor.state.ma.us/reports/rdPage.aspx?rdReport=PropertyTaxInformation.AssessedValuesbyClass.assessedvaluesbyclass.

57. Department of Revenue, Division of Local Services (2021). Municipal cherry sheet, receipts & charges. https://dlsgateway.dor.state.ma.us/reports/rdPage.aspx?rdReport=CherrySheets.CSbyProgMunis.cs_prog_munis.

58. Id.

59. Massachusetts Executive Office of Administration and Finance (2021). About COVID-19 federal funds. https://www.mass.gov/info-details/about-covid-19-federal-funds; Wagman, N. (2021, March 25). Where’s the relief? The distribution of federal funding in Massachusetts. Massachusetts Budget & Policy Center. https://massbudget.org/2021/03/25/wheres-the-relief-the-distribution-of-federal-funding-in-massachusetts/

60. Id.

61. Approximately $946 million of the $1.34 billion in ARPA funds directed to counties were allocated to the Commonwealth’s non-functional counties and will be reallocated to municipalities in those counties. It is yet to be determined when these funds will be reallocated. See also Young, C.A. (2021, June 10). Municipal coffers beginning to fill up with ARPA aid. State House News Service. https://www.wwlp.com/news/massachusetts/municipal-coffers-beginning-to-fill-up-with-arpa-aid/; Massachusetts Executive Office of Administration and Finance (2021). About COVID-19 federal funds. https://www.mass.gov/info-details/about-covid-19-federal-funds

62. Massachusetts Municipal Association (2021, June 2). Treasury’s ARPA guidance provides flexibility, focus on equity. https://www.mma.org/treasurys-arpa-guidance-provides-flexibility-focus-on-equity/.

63. Department of Revenue, Division of Local Services (2021). Revenue by source; Department of Revenue, Division of Local Services. (2021). Assessed values by class; Department of Revenue, Division of Local Services (2021). Tax Levies by Class. https://dlsgateway.dor.state.ma.us/reports/rdPage.aspx?rdReport=Dashboard.TrendAnalysisReports.TaxLevyByClass; Massachusetts Department of Revenue (2020, June). Monthly report of collections and refunds – June 2020, at 14. https://www.mass.gov/doc/june-2020-blue-book-final/download.

64. Id.

65. Schoenberg, S. (2021, January 21). Baker will propose implementing first year of new school funding formula. Commonwealth Magazine. https://commonwealthmagazine.org/education/baker-will-propose-implementing-first-year-of-new-school-funding-formula/; Wade, C.W. (2021, February 3). School funding a flashpoint in budget talks. The Daily News of Newburyport. https://www.newburyportnews.com/news/regional_news/school-funding-a-flashpoint-in-budget-talks/article_92db30a1-113b-5577-8ecc-087911d92c67.html.

66. St. 2019, c. 132. https://malegislature.gov/Laws/SessionLaws/Acts/2019/Chapter132.

67. Schoenberg, S. (2021, January 21), supra n.65; Wade, C.W. (2021, February 3), supra n.65. 

68. Jochem, G, & Paris, F. (2021, June 29). Berkshire public schools lost hundreds of students during the pandemic. Will they come back? The Berkshire Eagle. https://www.berkshireeagle.com/news/local/berkshire-public-schools-lost-hundreds-of-students-during-the-pandemic-will-they-come-back/article_dfd0f2fa-d8e1-11eb-93c7-bff6590c1e51.html.  

Help Us Improve Mass.gov  with your feedback

Please do not include personal or contact information.
Feedback