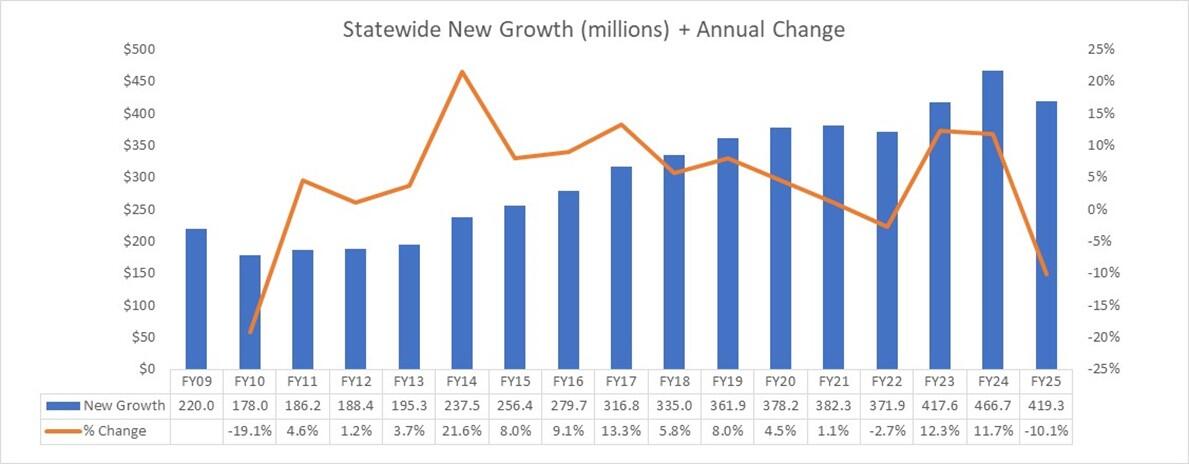
In the last edition of City & Town, Paula King from our Bureau of Local Assessment provided an insightful overview of New Growth. In the Part 1 article, we’ll focus on New Growth data and analyze recent trends in this important metric. FY2025 New Growth totaled $419M, a decrease of 10.1% ($47.3M) from FY2024. Of the decrease, 75% is attributable to Boston, who alone comprises approximately one-quarter of all New Growth each year. As shown in the graph below, this was the first decrease since FY2022 and only the second since FY2010.
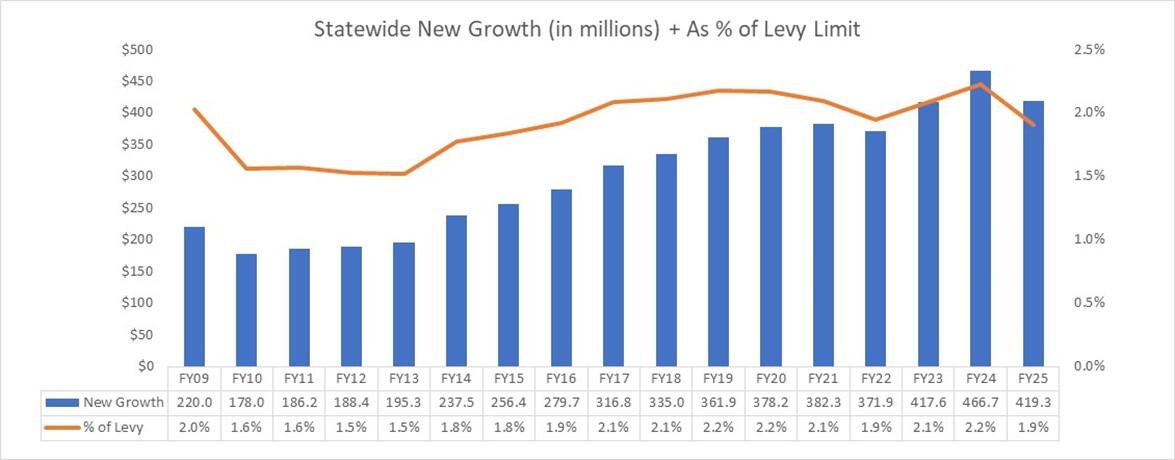
When measured as a percentage of the prior year levy limit, over the past decade New Growth has consistently been in the 1.9% - 2.2% range, except for FY’s 2010-2015. This is shown in the graph below.
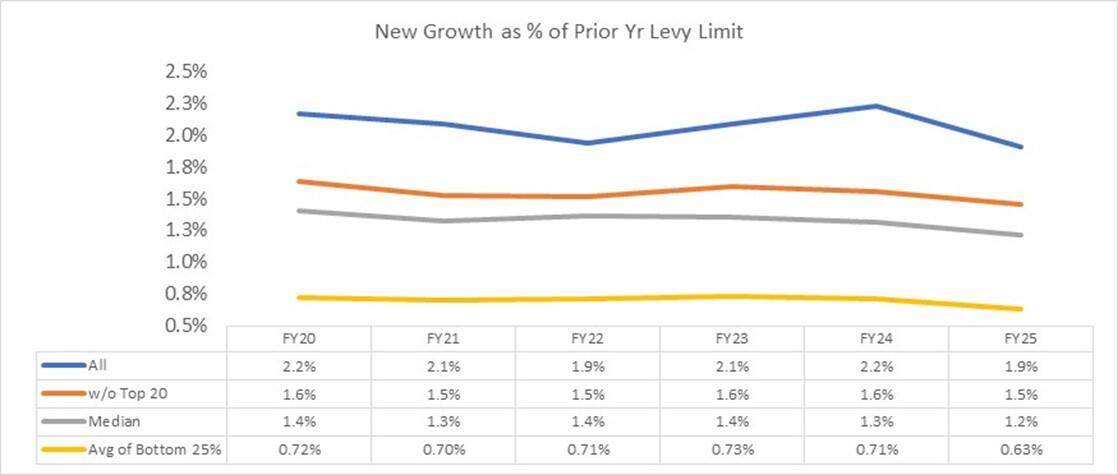
The top 20 municipalities in terms of New Growth generated comprise more than 50% of all New Growth, so it can be helpful to analyze this data without those 20 cities and towns. The table below shows New Growth measured as a percent of the prior year levy limit without those municipalities. Doing so drops the metric from 1.9% in FY2025 to 1.5%. The graph also includes the statewide median, which is at 1.2% in FY2025. Lastly, for the municipalities in the bottom 25% in terms of total New Growth, the metric is 0.6%.
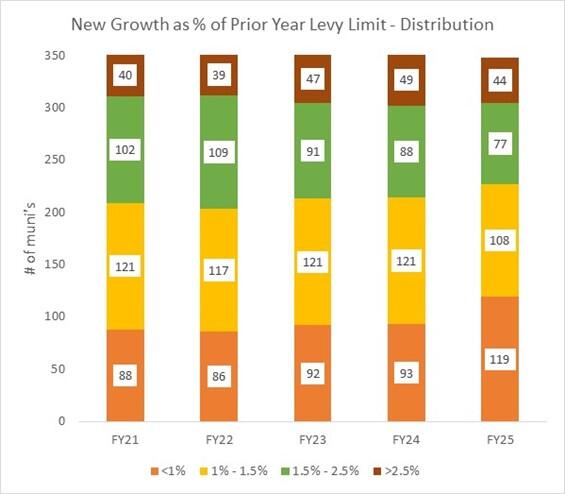
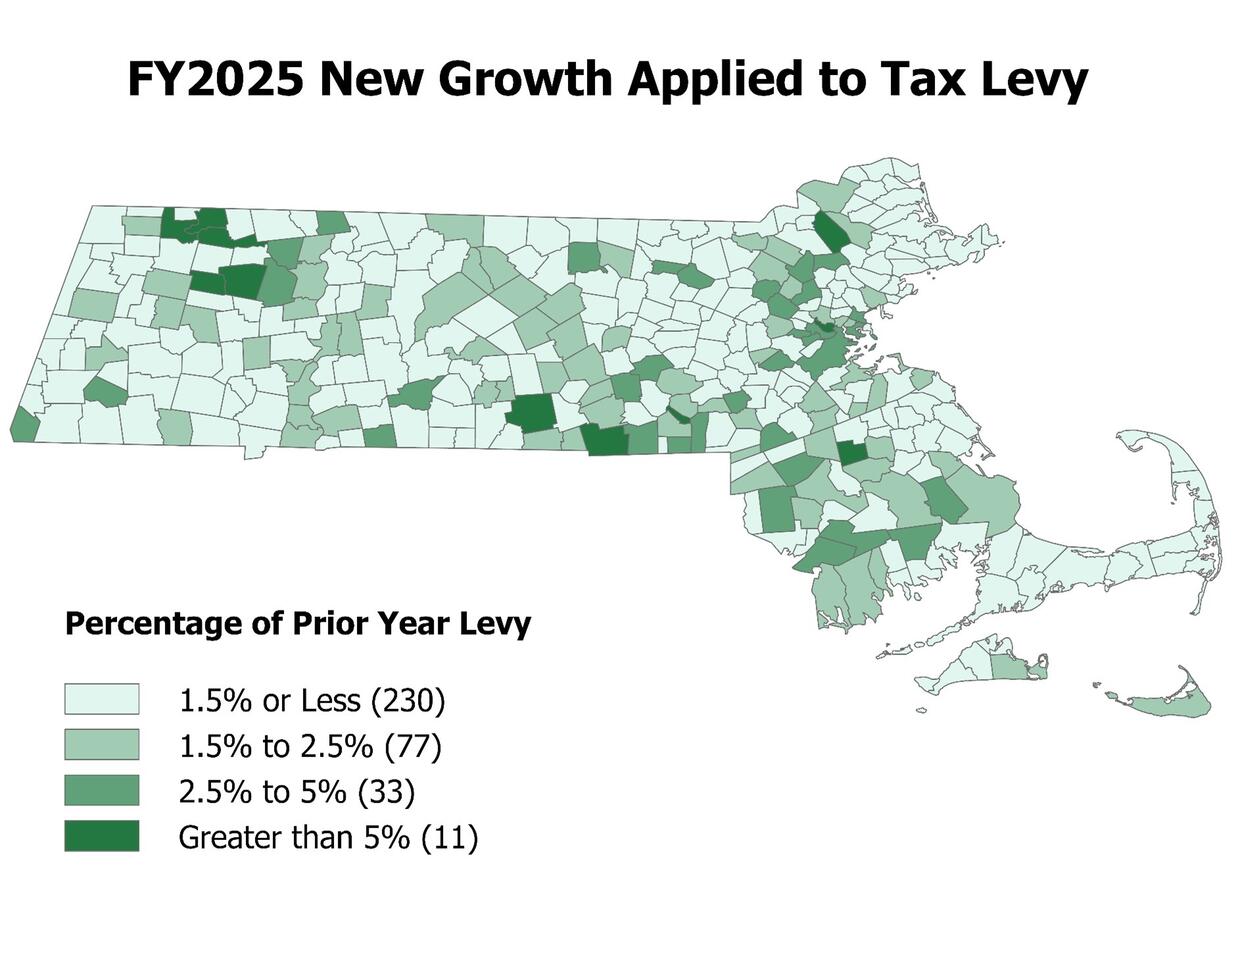
The next graph depicts the distribution, again measured as a percentage of the prior year levy limit, by fiscal year. It shows a relatively consistent composition in the high range (greater than 2.5%), but a trend of an increase in the lowest range (less than 1%). Approximately one-third of municipalities have New Growth measured as a percentage of the prior year levy limit fall in the lowest range and close to two-thirds have this metric at being no more than 1.5%.
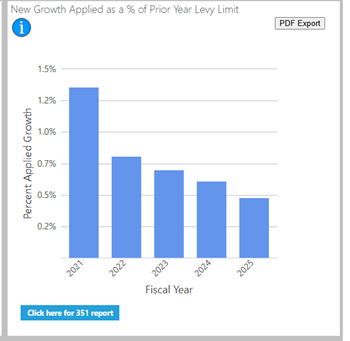
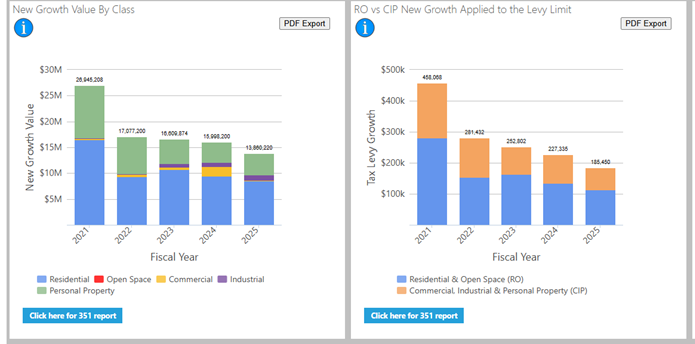
You can find this data for your community and depicted on the Municipal Finance Trend Dashboard, a snapshot of which is shown below. Visit the BLA Dashboard for additional information.
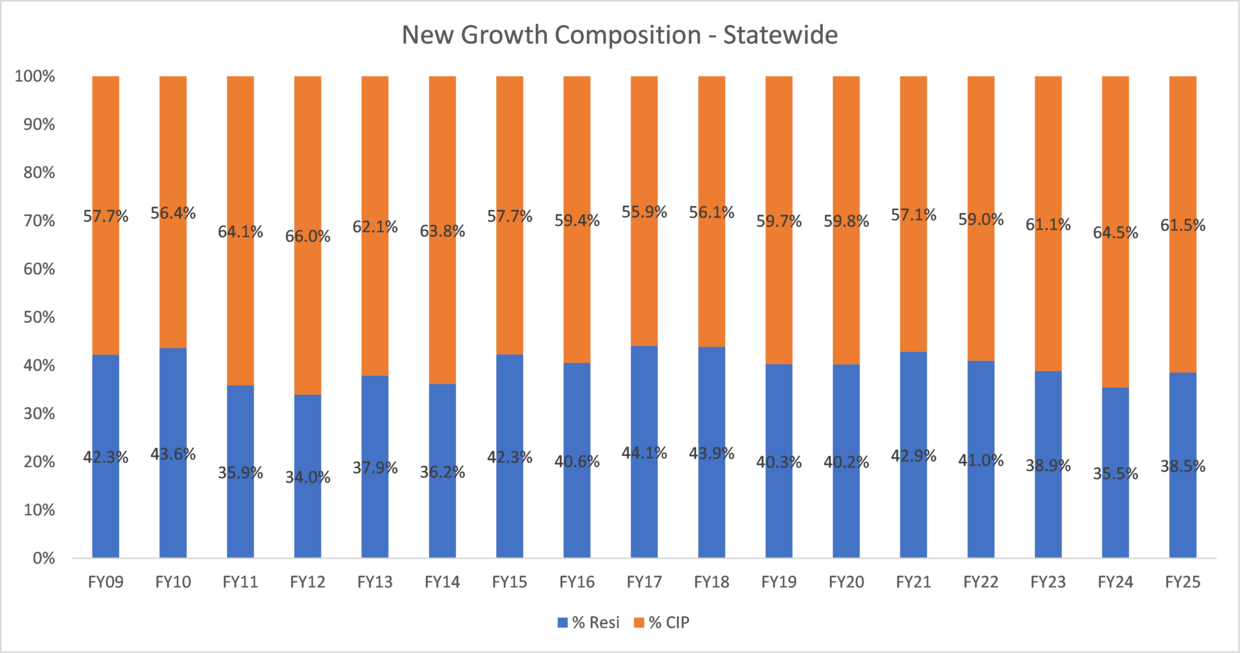
Another data set related to New Growth is its composition, i.e., from what classification of property is New Growth is being generated. As shown in the graph below, the Commercial/Industrial/Personal Property (CIP) category continues to generate the majority of New Growth. The split between Residential and CIP has been relatively consistent.
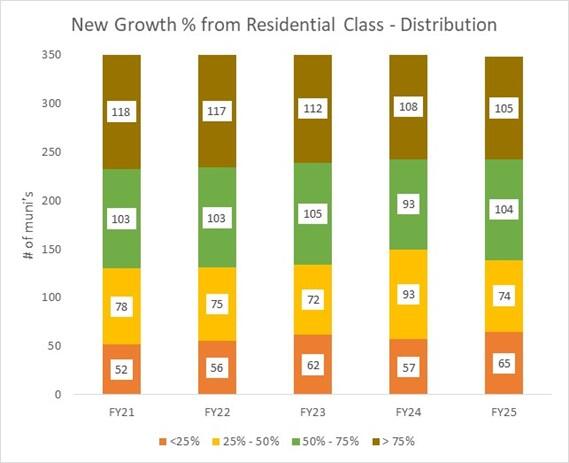
While in total dollar terms most of the $419M in New Growth comes from the CIP class, for most municipalities New Growth comes from the Residential class. As shown in the graph below, the number of municipalities dependent upon the Residential class for generating New Growth has been very consistent, with an average of approximately 215 (61%) cities and towns having more than 50% of New Growth come from the Residential class. Viewed another way, the CIP class accounts for the majority of New Growth in less than 40% of municipalities, on average, even though the state as a whole relies on the CIP for most New Growth.
You can find this data for your community and depicted on the Municipal Finance Trend Dashboard, a snapshot of which is shown below. Visit the BLA Dashboard for additional information.
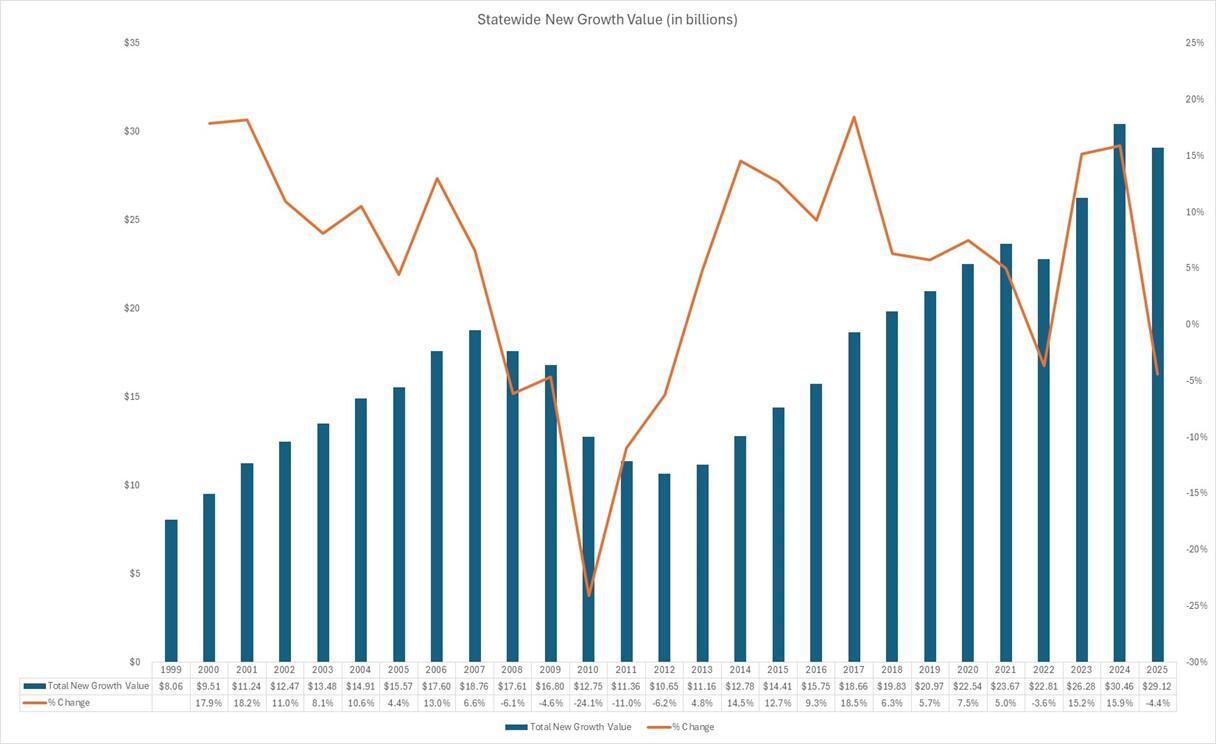
To this point, this article has focused on New Growth in terms of the amount of property taxes generated. This next data set shows the value of New Growth, which totaled $29.1B in FY2025. The graph below depicts the New Growth value and clearly shows the drop in New Growth caused by the Great Recession that occurred in CY2007 – CY2009. Since FY2014, New Growth value has increased significantly, from $12.8B to $29.1B, with only two years of decline (FY’s 2022 and 2025).
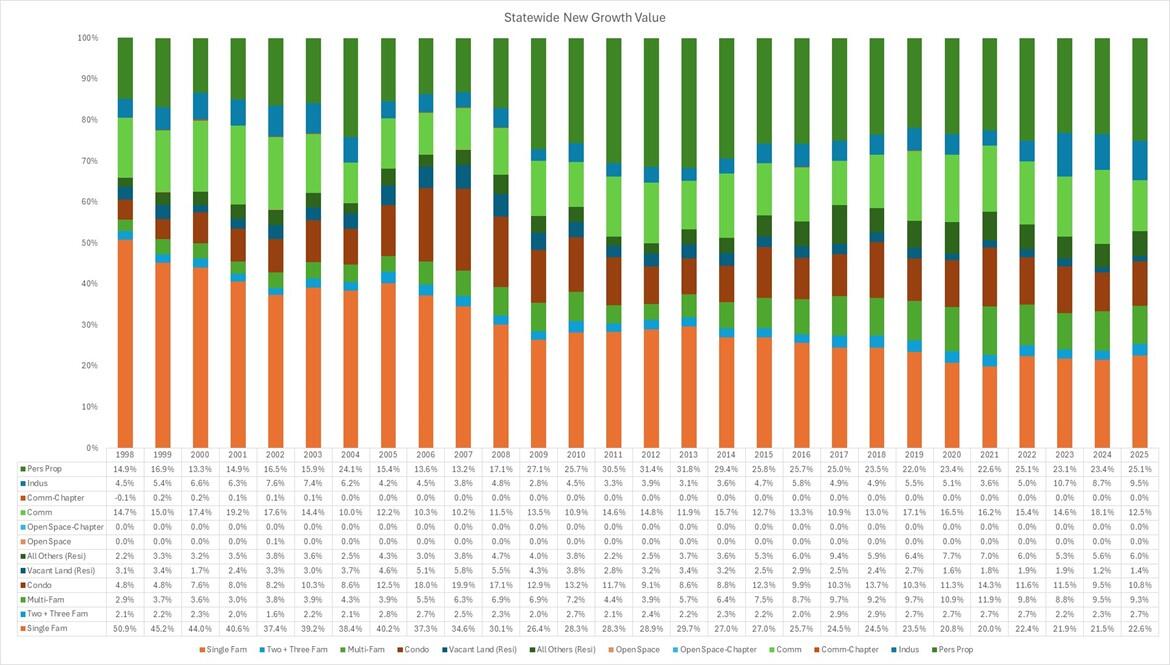
The next graph shows New Growth value broken out by property type (single family, condos, commercial, etc.). A few trends can be gleaned from the data set: (1) single family parcels have gone from comprising half of all New Growth value to an annual figure in the low-20%’s, (2) personal property has gone from comprising less than 15% to an annual figure approximately 25% annually and (3) commercial has remained relatively consistent at approximately 15% of total value.
We hope you've found this piece interesting and informative. If you have any suggestions for future DLS analysis or review, please let us know at dls_alerts@dor.state.ma.us.
Helpful Resources
City & Town is brought to you by:
Editor: Dan Bertrand
Editorial Board: Tracy Callahan, Sean Cronin, Janie Dretler, Emily Izzo, Christopher Ketchen, Paula King, Jen McAllister, Jessica Sizer and Tony Rassias
| Date published: | February 6, 2025 |
|---|