The January 16th, 2025 edition of City & Town contained an article on FY2025 property tax levies, assessed values and tax rates. This article expands on the property tax structure under Proposition 2 ½, with a focus on the levy ceiling and excess levy capacity. Under Proposition 2 ½, there are certain restrictions on the amount of property taxes that a municipality can levy:
- the levy cannot exceed 2.5% of the assessed value (AV) of the community. This is known as the levy ceiling.
- the annual maximum levy increase is 2.5% of the prior year’s levy limit, plus new growth (see this City & Town article for information on new growth). This amount can only be increased by a vote of the electorate via an override, a debt exclusion or a capital exclusion.
Related to these restrictions, excess levy capacity is the difference between the amount of property taxes a community can levy in a fiscal year and what it actually chooses to levy in that year. For more information on these and other key Proposition 2 ½ concepts, view this playlist on our YouTube page. The graphics below illustrate how the restrictions under Proposition 2 ½ come into play.
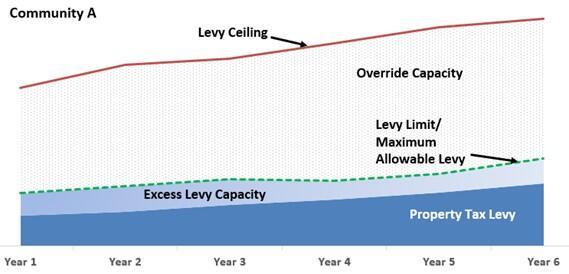
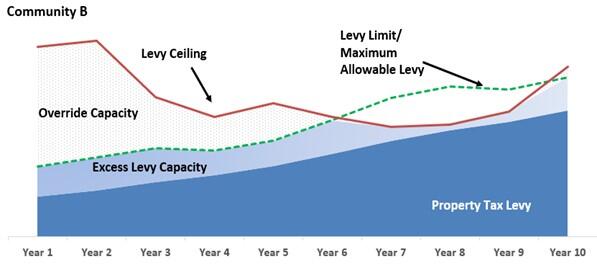
The graphic labeled Community A shows a municipality that is below its levy ceiling (2.5% of AV), evidenced by the green line being well below the red line. In that municipality, its actual property tax levy is below the levy limit, resulting in excess capacity. The graphic labeled Community B shows a municipality whose levy ceiling has decreased (due to a reduction in AV). Since the red line falls below the green line, this municipality has “hit the ceiling”. While this graphic doesn’t depict it, it is worth noting that, while extremely rare, a municipality could have to reduce its tax levy in order to comply with the levy ceiling.
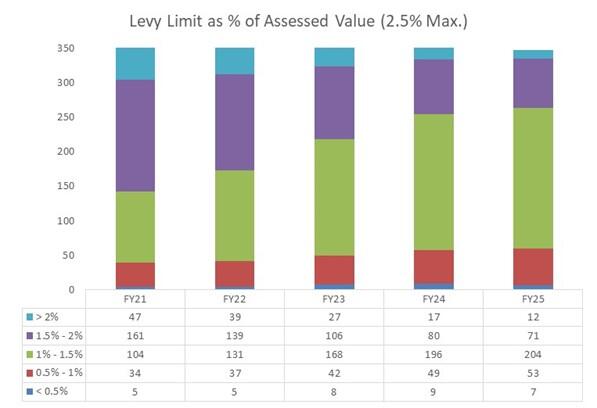
The table below shows the distribution of the 351 municipalities’ levy limit as a percent of assessed value for each of the past five years. (As of the writing of this article, four municipalities did not have a tax rate set for FY2025.) A key takeaway is that the levy ceiling is not an issue for nearly all cities and towns. However, if the economy were to change in a way that negatively impacted property values, it could become an issue for more municipalities.
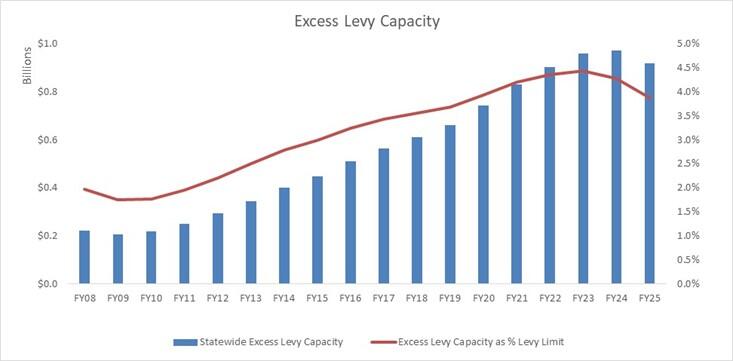
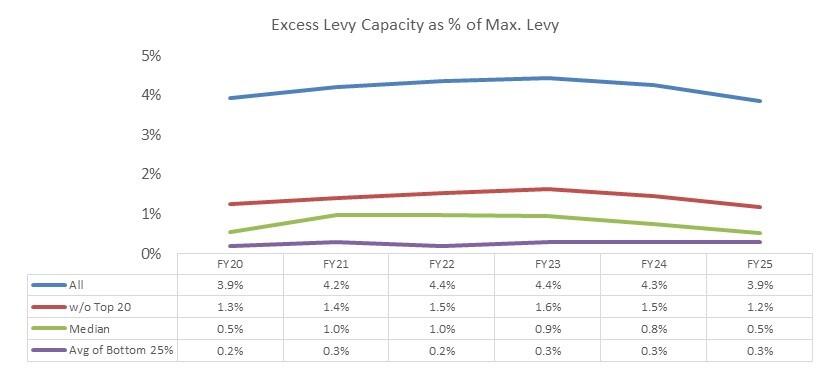
Turning to excess levy capacity, the graph below shows statewide excess levy capacity being $918M in FY25, equivalent to 3.9% of the levy limit. Over the data set, the growth has been significant: there has been a fourfold increase from $220M to $918M. Accordingly, when measured as a percentage of the levy limit, the increase has been large: from 2% to 3.9%.
However, the top 20 municipalities account for 75% of all excess levy capacity, so they have an outsized impact on the overall picture. The graph below measures excess levy capacity as a percentage of the levy limit over a period of time in four ways: (1) for the state as a whole, (2) the statewide total without the top 20 municipalities, (3) the median and (4) the bottom quartile. A few observations:
- When the top 20 are backed out, the spread between the resulting figure and the state as a whole drops significantly, from 3.9% to 1.2%.
- The median is 0.5%, which is the same as FY20 but half of what it was in FY22.
- The bottom quartile is 0.3%, meaning those municipalities are annually taxing very close to the annual levy limit.
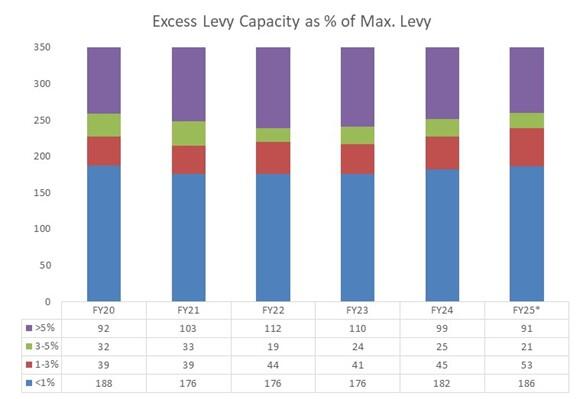
Looking at the distribution of excess levy capacity as a percent of the levy limit, which is depicted in the graph below, most municipalities are taxing near their annual levy limit. (As of the writing of this article, 4 municipalities did not have tax rate set for FY2025. In those cases, the FY2024 amount was used.) A couple of observations:
- More than half of the municipalities (186) have excess levy capacity equivalent to less than 1% of maximum levy.
- The number at the low-end has been increasing since FY21, meaning more municipalities are taxing closer to their annual limit.
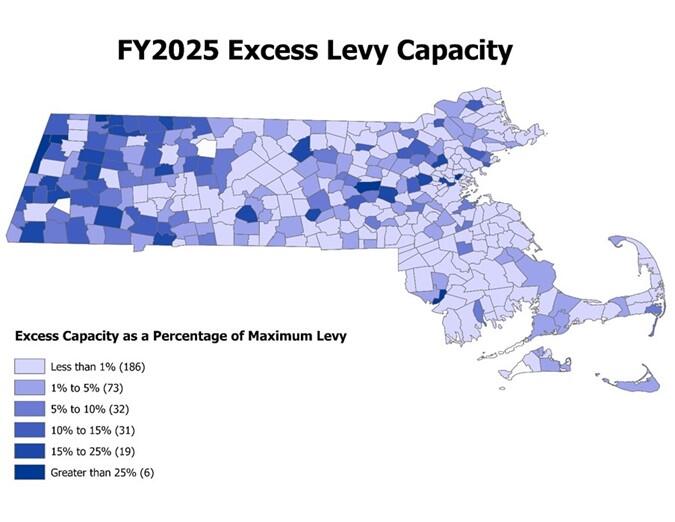
Below is a heat map for this metric. You can see a similar statewide heat map and historical information for your city or town at our Trends in Excess Levy Capacity Dashboard.
It is important to tie these two metrics together, as a community could be close to their 2.5% of AV levy ceiling, but have a large amount of excess levy capacity, which is a very different situation to be in than being close to the levy ceiling and having little excess levy capacity. In the case of the former, that municipality has the ability to “tap into” excess levy capacity and have greater flexibility to increase its property tax levy. As for the latter, hitting the levy ceiling would mean a smaller increase in the property tax levy, if not an outright decrease.
Earlier in this article, it was stated that in FY2025 only 12 municipalities had the levy limit greater than 2% of assessed value, meaning they are close to the levy ceiling. The table below shows both the levy limit and the actual property tax levy as a percentage of assessed value, bringing these two metrics together.
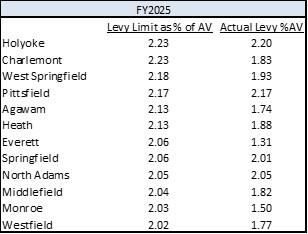
Let’s look at the first two municipalities in the table to show how these work in unison:
- Holyoke is relatively close (2.23%) to the 2.5% levy ceiling, but has a property tax levy as a percentage of AV slightly less than that (2.2%). That is due to the city having some excess levy capacity ($912K, or 1.3% of the maximum levy).
- Charlemont has the same 2.23% figure, but its actual levy is only 1.83% of AV due to having a large amount of excess levy capacity ($781K, 18%).
- By virtue of having more excess levy capacity (measured as a percentage of the maximum levy), Charlemont is further away from “hitting the ceiling” than Holyoke, even though both have the same levy limit as a percentage of AV (2.3%).
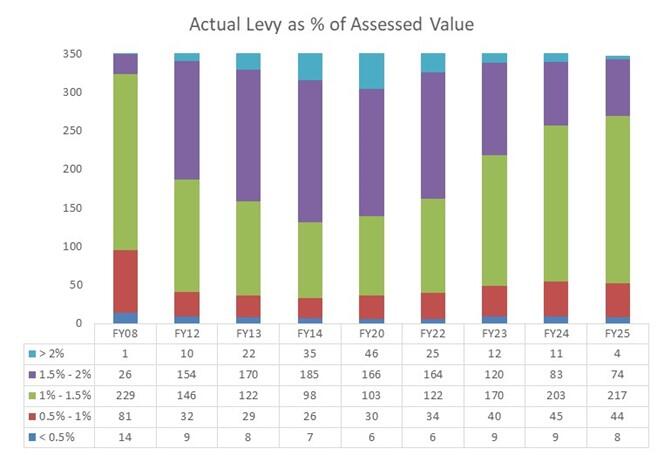
Looking at the actual levy as a percentage of AV is the important metric, as it takes into account excess levy capacity. That’s the true measure of how close a municipality is to “hitting the ceiling” under Prop 2 ½. Of the 12 in the table, only four have an actual levy equal to at least 2% of AV. It is interesting to look at this metric at various points over the past two decades. As shown in the graph below, prior to the Great Recession, only one municipality had an actual property tax levy equivalent to more than 2% of assessed value and 229 were in the 1% - 1.5% range. In FY12, those figures changed dramatically, with 10 in the greater than 2% range and 154 (up from 26 in FY08) in the 1.5% - 2% range. By FY20, there were 46 in the greater than 2% range, and that number has since decreased to 4 in FY25 due to the large increase in property values statewide. Also, more than 60% now fall in the 1% - 1.5% range, basically back to the FY08 level.
Make sure to take advantage of the Municipal Financial Self-Assessment Dashboard, as it provides a simple graphic to represent these two metrics for each municipality. The two images below depict the Holyoke (left) and Charlemont (right) examples used above.
For most cities and towns, the levy limit, not the levy ceiling, is the immediate concern. Even so, assessors and budget officers should annually review their city or town’s levy ceiling situation. A key takeaway here is that a limit collision may not be cause for budget panic if the tax levy is set comfortably below the levy ceiling (i.e., excess levy capacity).
We continually strive to bring relevant and useful content to City &Town readers. Please email us with questions, comments, and suggestions for future topics at cityandtown@dor.state.ma.us.
Helpful Resources
City & Town is brought to you by:
Editor: Dan Bertrand
Editorial Board: Tracy Callahan, Sean Cronin, Janie Dretler, Jessica Ferry, Emily Izzo, Christopher Ketchen, Paula King, Jen McAllister and Tony Rassias
| Date published: | April 3, 2025 |
|---|