Biological mapping identifies specific locations where various organisms or natural groupings of organisms have been found, either through grab samples or photography. Since 2010, CZM has been using infaunal grab samples (sediment samples sieved to reveal the small, sediment-dwelling animals) and seafloor imagery to map the distribution, and in some instances the abundance and relationships, of flora and fauna in Massachusetts marine waters. This web page describes the following biological mapping tasks conducted by CZM:
- Infauna Collection
- Photo and Video Interpretation
- Biological Classification System
Infauna Collection
CZM and its partners, the Massachusetts Division of Marine Fisheries (MarineFisheries) and the U.S. Environmental Protection Agency (EPA), began sampling marine infauna (small sediment-dwelling organisms) in 2010. Using the EPA Ocean Survey Vessel Bold as a platform and a 0.04 square-meter modified Van Veen grab, CZM collected 100 infauna samples in Cape Cod Bay in 2010. The data from this project were published in Sediment Grain Size and Benthic Infaunal Analysis in Support of CZM's Survey on the OSV Bold: Validation of Seafloor Sediment Maps in Massachusetts Bay and Cape Cod Bay (PDF, 6 MB). During Bold research cruises in 2011 and 2012, which included the use of the U.S. Geological Survey (USGS) SEABOSS (Sea Bottom Observation and Sampling System) sampling system, CZM gathered 214 infauna samples south of Cape Cod and 207 infauna samples north of Boston (in 2011 and 2012 respectively). The 2011 data were published in ENV12 CZM 01 Benthic Infaunal Analysis Report (PDF, 15.1 MB), and the 2012 data were published in ENV13 CZM 01 Benthic Infaunal Analysis Report (PDF, 3 MB).
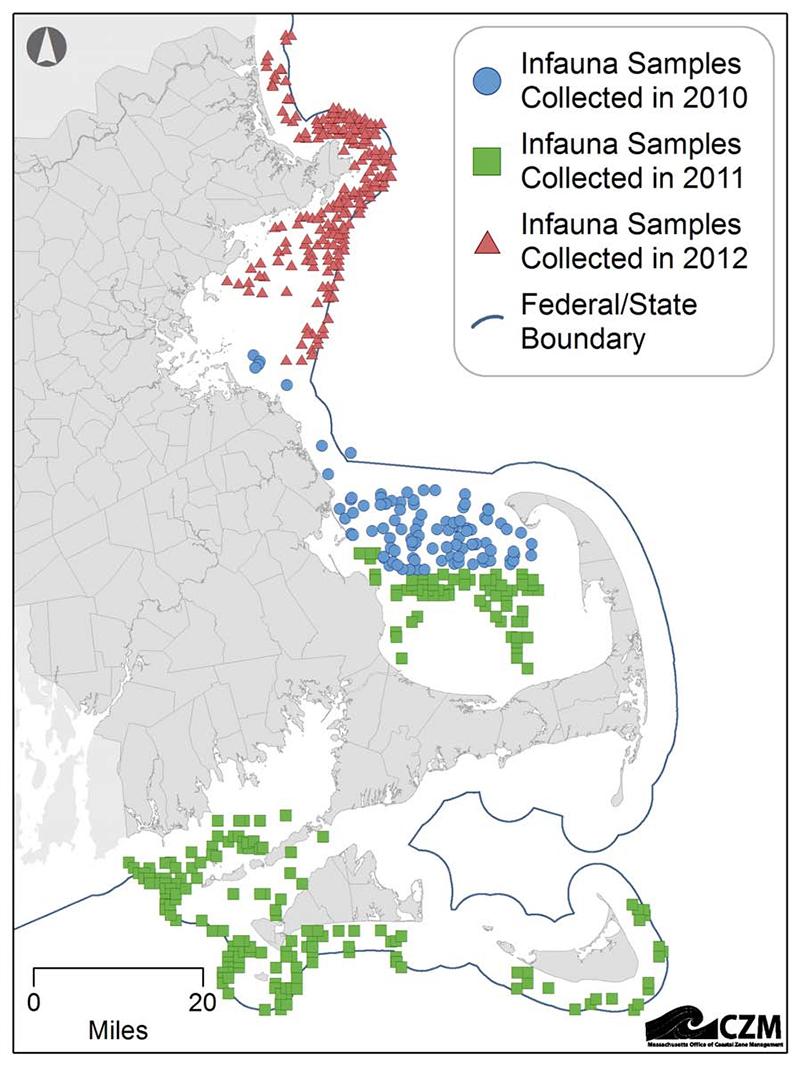
Locations of all infauna samples collected by CZM and its partners between 2010 and 2012. Full-size image (PDF, 108 KB)
CZM uses the infauna, seafloor sediment, and depth data collected at each sample site to identify distinct infaunal communities in Massachusetts (as seen in the circled areas in the figure below). These types of patterns in infauna communities can be used to identify not only the most common communities, but also the rarest. The data can also help to identify areas that have the highest and lowest densities of infauna and to determine which types of infaunal organisms (e.g., crustaceans, worms, or clams) dominate a particular area of the coast.
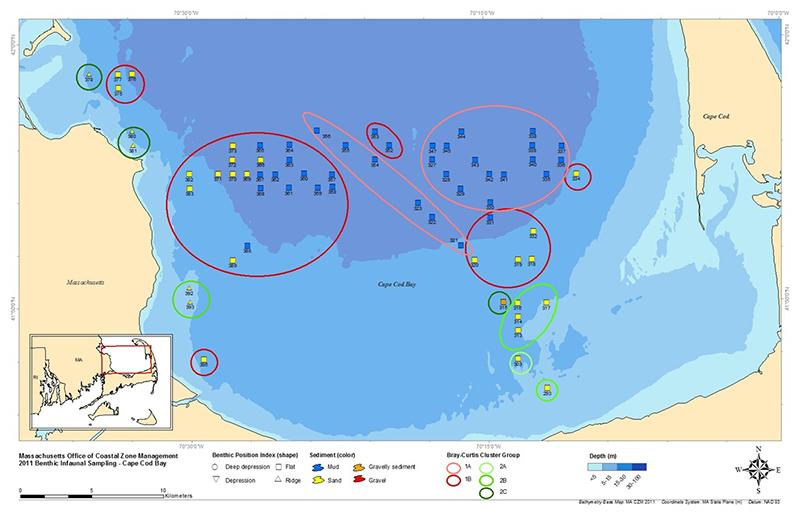
Infaunal communities identified in Cape Cod Bay in 2011. Sampling locations are identified as colored shapes (squares or triangles). The color of a sampling location represents the seafloor sediment type at that location (blue = mud, yellow = sand, orange = gravel). Statistically similar infaunal communities are located within the ovals. For example, the communities in pink ovals share 65% of the same infauna families. Full-size image (PDF, 415 KB)
Photo and Video Interpretation
To date, over 10,000 images of the seafloor have been obtained from the CZM-USGS Seafloor Mapping Cooperative and the Bold surveys. Each photo or video-screen capture contains information on the seafloor sediment in a given location, in addition to habitat structures and their associated organisms. CZM is using this imagery data to help categorize and map important habitats and species-habitat associations. For example, kelp is a type of canopy forming algae that serves as a habitat and food source for many species. The imagery of the seafloor can be used to determine where these canopy forming species are in the region and what habitat and locations they occupy. The bottom photos and videos taken during the Bold surveys are currently in the process of official publication by USGS.
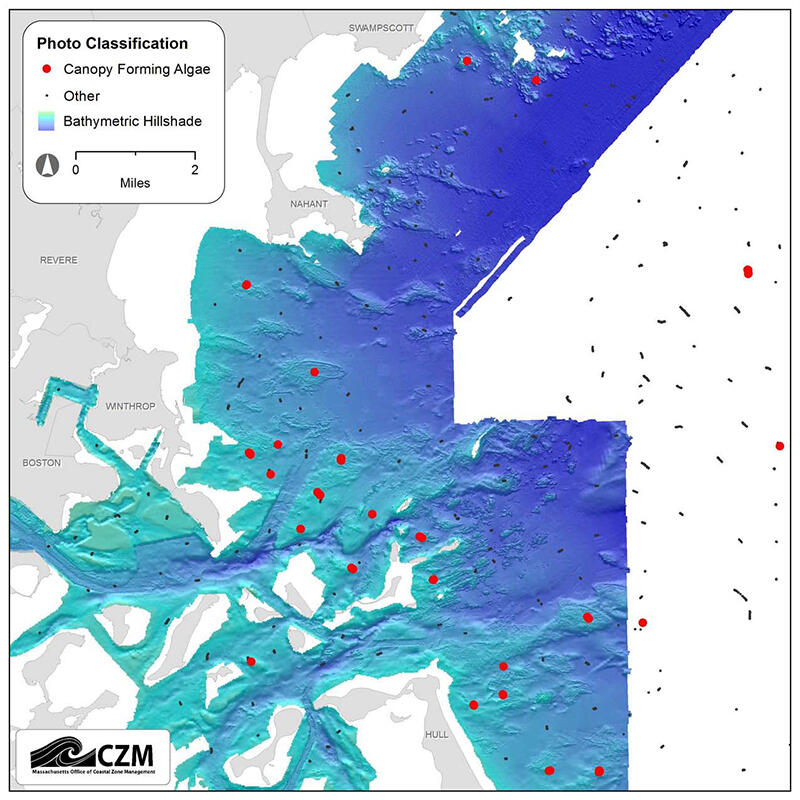
A map of canopy forming algae (kelp) distribution derived from photos in the Nahant to Gloucester and Boston Harbor CZM-USGS Seafloor Mapping Cooperative and the Bold 2012 datasets. These data were overlaid with bathymetry to demonstrate the preference of these species for areas with hard rugged substrate for attachment. Full-size image (PDF, 156 KB)
Biological Classification System
The biological information in the imagery is classified according to a modified version of the Coastal and Marine Ecological Classification Standard (CMECS) Version 4.0, Benthic Biotic Component, to standardize the way the photos are used and analyzed. CMECS (PDF, 8 MB), a Federal Geographic Data Committee standard, is a hierarchal system that provides a means for classifying ecological units using a standard format.
In the CMECS Benthic Biotic Component, biotic classification is defined by the dominance of stable, fixed (sessile), or slow moving species visible in the photo. Since more than one group of organisms is sometimes captured in the photos, and some species may be present but not be recorded in the classification scheme (such as fish, crabs, etc.), two co-occurring biotic groups and two associated taxa are also included in the classification system. See the photo below of kelp, other algae species, sponges, and sea stars for an example of how the photographs are classified for mapping and analysis purposes.
- Biotic Class: Aquatic Vegetation Bed
- Biotic Subclass: Benthic Macroalgae
- Biotic Group: Canopy-Forming Algal Bed
- Co-Occurring Modifier 1: Coralline/Crustose Algal Bed
- Co-Occurring Modifier 2: Filamentous Algal Bed
- Associated Taxa Modifier 1: Porifera (sponge)
- Associated Taxa Modifier 2: Henricia sanguinolenta (blood star)
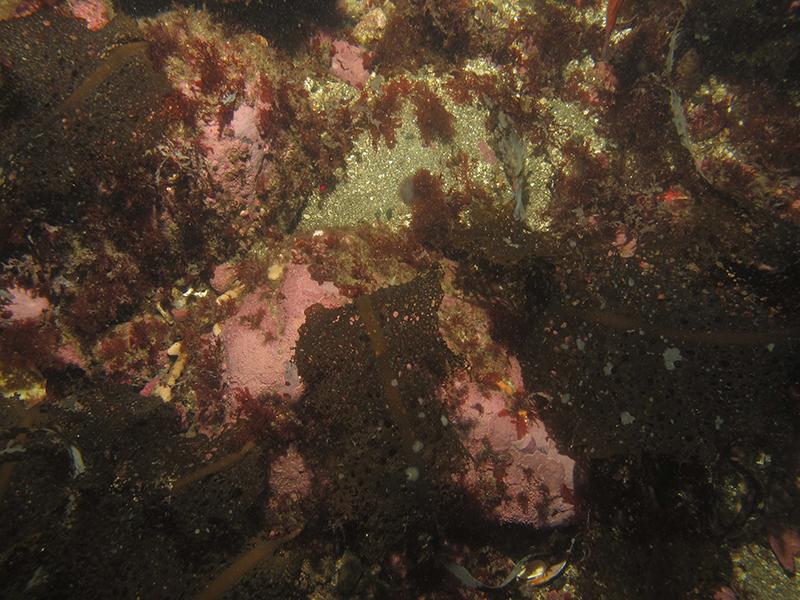
Photograph from the Bold 2012 survey of Agarum clathratum (canopy forming algae), crustose (bubblegum) algae, filamentous algae, sponges, and other species, with accompanying CMECS Benthic Biotic Component Classification (see above). Full-size image (PDF, 436 KB)
CZM is also analyzing seafloor images to evaluate the Massachusetts Ocean Management Plan’s “Hard/Complex Seafloor” map (PDF, 2 MB) to determine which organisms and groups of organisms are typically found within the boundaries of the mapped Special, Sensitive, or Unique resource areas identified in the plan. Since the Hard/Complex Seafloor map was developed based on information about the seafloor bottom, this will give CZM a better idea of what organisms are present in these habitats and thus protected under this aspect of the Massachusetts Ocean Management Plan.
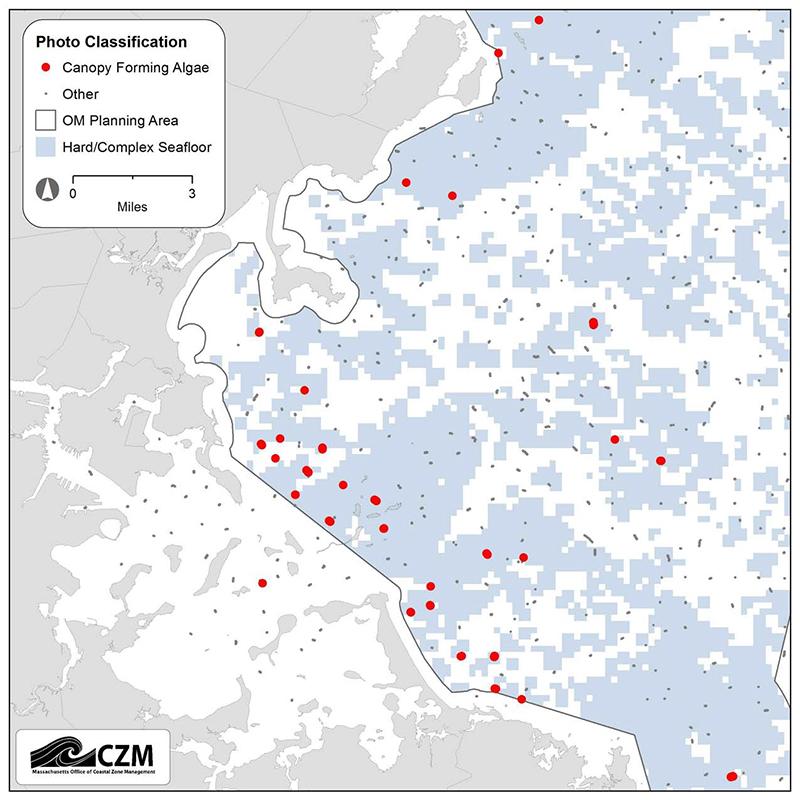
A map of canopy forming algae (kelps) classified from photos in the CZM-USGS Seafloor Mapping Cooperative and the Bold survey datasets overlaid with the Massachusetts Ocean Management Plan’s Hard/Complex Seafloor map. Full-size image (PDF, 124 KB)