Overview
Each year, the Commonwealth provides financial resources, often referred to as local aid, to municipalities and regional school districts (RSDs) through a series of formulae. While some types of aid are explicitly discretionary or subject to appropriation, others are required by state law to be provided. Communities can view their allocation of local aid through the state’s “Cherry Sheet,” an official notification by the Department of Revenue that breaks down estimated allocations for large programs such as Chapter 70 education aid and Unrestricted General Government Aid (UGGA) as well as smaller programs such as municipal reimbursements for veterans’ benefits.1 Other local aid categories appear as legislative appropriations in line items in the state budget.
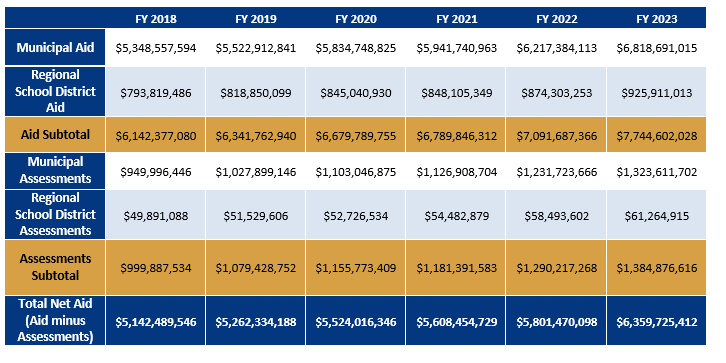
However, full funding of the state’s commitments to municipalities has been a historical exception to the rule, since the Legislature annually determines how much will be allocated to specific programs, if anything at all. Insufficient allocations of local aid have resulted in shortfalls, which need to be supplemented by municipal revenues, thus increasing upward pressure on the local tax levy. In addition, there are countervailing assessments on municipal and regional local aid (such as payments for regional transit authorities and sending tuition for charter schools) that reduce the impact of these aid programs. Approximately $7.7 billion in local aid is allocated in fiscal year (FY) 2023, but the net sum after assessments is $6.4 billion.2 The two statistics tend to track each other: over the past five years, the amount of money appropriated to local aid programs has risen by 26%, nearly mirroring the 24% increase in the amount net of assessments (see Figure 1).3
Figure 1 - Summary of Cherry Sheet Aid, FY 2018 through FY 20234
Recent developments, however, have been very encouraging. The Legislature’s FY 2023 budget, which was signed by the Governor on July 28, 2022, represents a big step toward a closer partnership between the Commonwealth and its municipalities and school districts. The budget provides significantly higher funding in many of the categories of concern for this report, most notably a $500 million increase in Chapter 70 school aid due to the phase-in of the provisions of the Student Opportunity Act (SOA) of 2019. Other categories seeing increases include UGGA ($63 million), the Special Education Circuit Breaker program ($67 million), and payments in lieu of taxes (PILOT) for state-owned land ($10 million).5 Nonetheless, these increases only go part of the way to reducing local burdens and closing shortfalls in state commitments to local spending (see Figure 4).
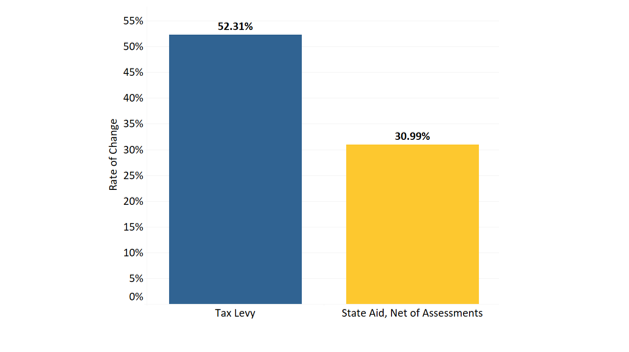
As DLM has noted in previous municipal impact reports, municipalities are increasingly reliant on higher property tax levies, as aid from the state fails to grow at the same rate as school and municipal expenses.6 Between FY 2012 and FY 2022, the growth in the major categories of state aid trailed that of property tax collections, as seen in Figure 2.
Figure 2 - Changes in Tax Levy and State Aid Revenue Growth, FY 2012 - 20227
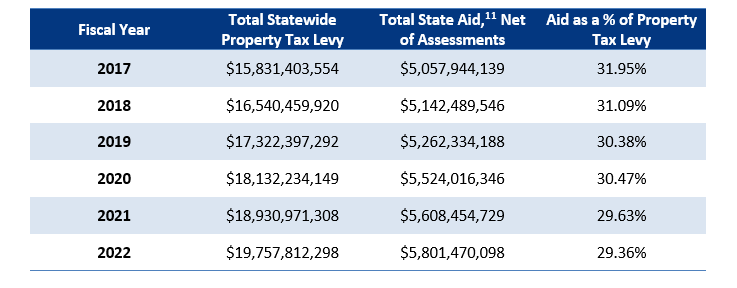
Tax levy growth for the most recent six-year period demonstrates a similar trend. Between FY 2017 and FY 2022, communities increased their tax levy by over 24.8%, far outpacing net state revenue, which grew at 14.7%.8 According to Figure 3, local aid (net of assessments) represented almost 32% of the statewide property tax levy in FY 2017 but shrank to 29% by FY 2022.9
Figure 3 - Proportion of State Aid to Property Tax Levies of Massachusetts Cities and Towns, FY 2017 through FY 02210
This report will review various categories of state aid and reimbursement programs, estimate the potential for increases, and suggest priorities for a stronger partnership between the Commonwealth and its municipalities and school districts. This report is the result of an analysis of data from state agencies and significant input from stakeholders, who are identified in Appendix A. Because there are some programs that do not fit the framework of unmet state commitments, this report does not include all state aid programs, grants, reimbursements, and general appropriations.