School Transportation
Regular Day School Transportation (M.G.L. c. 71, § 7A)
Status: No funding
Estimated expenses (FY 2021): $157,868,34813 FY 2021 Reimbursement: none
The state treasurer shall annually, on or before November twentieth, pay to the several towns subject to appropriation, the sums required as reimbursement for expenses approved by the commissioner of education, incurred by any town for the transportation of pupils not more than twice daily between any school within the town, or in another town, and the pupil's home, a child care center licensed or approved by the department of early education and care, or a child care facility which is part of a public school system or a private, organized educational system. . . .
No town shall be reimbursed for its transportation expense, in any year, an amount less than the amount of reimbursement for such expense received in the year nineteen hundred and forty-six.14
Regular day school transportation reimbursement is authorized under M.G.L. c. 71, § 7A. However, the line item in the state budget reimbursing regular day transportation for municipal school districts has not been funded for decades, as it is subject to appropriation. Districts are required to provide transportation for students in grades K through 6 who live more than two miles from their school if their bus stop is more than one mile from their home.15 Data from the Department of Elementary and Secondary Education (DESE) reveals a local burden of over $157 million for regular day school transportation covered by this section of M.G.L.16 There are also another $65 million in additional expenses absorbed by school districts to transport students who live less than 1.5 miles from schools (but this sum is not reimbursable under the law).17 In total, regular day school transportation, net of regional school transportation, represents nearly a third of the $700–$800 million in annual school transportation expenses, yet receives zero reimbursement.
In-District Special Education Transportation (M.G.L. c. 71B, § 8)
Status: No funding
Estimated expenses (FY 2021): $191,432,02518 FY 2021 Reimbursement: none
If a school age child with a disability attends a school approved by the department within or without the city or town of residence of the parent or guardian, the school committee of the town where the child resides may be required by the department to provide transportation once each day including weekends where applicable to and from such school while the child is in attendance. The city or town providing transportation under this section shall be reimbursed according to the provisions of section fourteen.
Reimbursement of school transportation expenses for in-district special education is authorized under state law via M.G.L. c. 71B, § 8. However, the provision is now confusing because it references another section of M.G.L that has been repealed by the 2019 SOA.19 As such, DLM believes that in its absence, M.G.L. c. 71, § 7A authorizes reimbursement for in-district transportation of students, regardless of their status. This category was responsible for over $191 million in expenses and, along with regular day school transportation, represented over half of school transportation costs in FY 2021.20 Again, communities have not received any reimbursement for this particular category of expenses despite the commitment in state law. Although state regulations require in-district transportation to be supplied to all students with an Individualized Education Program (IEP) calling for transportation services, reimbursement under law is only limited to those who live more than 1.5 miles from a public school.21
Out-of-District Special Education Transportation (M.G.L. c. 71B, § 5A)
Status: Partial funding (per Special Education Circuit Breaker)
Estimated expenses (FY 2021): $100,564,26022 FY 2022 Reimbursement: $18,573,66623
Out-of-district (OOD) special education transportation occurs when a student’s needs (as outlined in their IEP) are met through a program outside the school district, such as a special education collaborative or private school. The SOA made a significant change to the calculation of special education “circuit breaker” reimbursements by adding OOD transportation to the expenses that can be claimed for partial reimbursement.24 Eligible OOD expenses match what public and private schools are required to supply under law, including in-house transportation or private, contracted providers.25 Although almost $18.6 million in transportation reimbursements were distributed to communities through the Special Education Circuit Breaker in FY 2022, this amount represented less than 20% of total OOD expenses from the 2020–2021 school year.26 This reimbursement is a good first step, however, as it will phase in more assistance over four years, ultimately allowing “100 per cent of all required OOD transportation costs eligible for reimbursement [by] fiscal year 2024.”27 The FY 2023 budget speeds the implementation of the OOD special education phase-in, by allowing 75% of expenses to be eligible for reimbursement. However, once fully implemented, circuit breaker transportation reimbursements will continue to be restricted to 75% of expenses for those students whose tuition costs exceed the approved costs threshold.28
Regional School District Transportation (M.G.L. c. 71, § 16C)
Status: Partial funding
Estimated expenses (FY 2022): $91,332,607 FY 2022 Reimbursement: $82,178,61129
The regional school district shall be subject to all laws pertaining to school transportation; and when the agreement provides for the furnishing of transportation by the regional school district, the regional school district shall be obliged to provide transportation for all school children in grades kindergarten through twelve and the commonwealth shall reimburse such district to the full extent of the amounts expended for such transportation, subject to appropriation; provided, however, that no reimbursement for transportation between school and home shall be made on account of any pupil who resides less than one and one-half miles from the school of attendance, measured by a commonly traveled route. . . . The state treasurer shall annually, on or before November twentieth, pay to the regional school districts, subject to appropriation, the sums required for such reimbursement and approved by the commissioner of education.30
Regional school districts are required to transport all students to and from school, regardless of their grade and their distance from the school.31 Although reimbursement for regional school transportation has been a commitment under M.G.L. c. 71, § 16C since 1949, funding is restricted to students who live more than 1.5 miles from the school. This program represents the one major state incentive that exists to encourage regionalization of schools. Reimbursements are especially vital for RSDs located in rural parts of the state, as the service area for these districts tend to be large and require longer travel times. RSD transportation reimbursements have been funded at various levels over the last five fiscal years—from as low as 71.31% in FY 2018 to as high as 96.2% in FY 2021.32 According to members of the Legislature, it is anticipated that level funding at $82 million will result in a reimbursement level of 85% for FY 2023.33
Out-of-District Vocational School Transportation (M.G.L. c. 74, § 8A)
Status: Partial funding
Estimated expenses (FY 2022): $4,466,576 FY 2022 Reimbursement: $250,00034
A municipality, wherein a person resides who is admitted to a day school in another municipality under section 7, shall, through its school committee, when necessary, provide for the transportation of such person, and shall, subject to appropriation, be entitled to state reimbursement to the full extent of the amount so expended.35
Under M.G.L. c. 74, § 8A, the state is required to reimburse school districts that transport students to an out-of-district vocational school. While students have a right (subject to the review of an application) to attend a program at a vocational school in a district different than their own, communities are prohibited from providing transportation if the students live less than 1.5 miles from the school. This transportation reimbursement has been funded at various levels, but an appropriation of $250,000 per year has been the norm in recent years. OOD vocational school transportation expenses totaled $4,466,576 in FY 2022, of which a mere 5.6% is reimbursed by the Commonwealth.36 As a result of insufficient funding provided for this category of expenses, the Office of the State Auditor has heard from small communities in rural parts of the state about the financial burden imposed by the lack of full reimbursement.37 The Commission on the Fiscal Health of Rural School Districts has also publicly reiterated concerns from school officials and advocated to the Legislature to fully fund OOD vocational school transportation.38
School Transportation for Students Experiencing Homelessness (McKinney-Vento Homeless Assistance Act, Public Law 100-77)
Status: Full funding
Estimated expenses (FY 2022): $11,396,29839 FY 2022 Reimbursement: $11,527,24840
For any State desiring to receive a grant under this part, the State educational agency shall submit to the Secretary a plan to provide for the education of homeless children and youths within the State. Such plan shall include the following: . . .
(J) Assurances that the following will be carried out: . . .
(iii) The State and the local educational agencies in the State will adopt policies and practices to ensure that transportation is provided, at the request of the parent or guardian (or in the case of an unaccompanied youth, the liaison), to and from the school of origin (as determined under paragraph (3)), in accordance with the following, as applicable:
(I) If the child or youth continues to live in the area served by the local educational agency in which the school of origin is located, the child's or youth's transportation to and from the school of origin shall be provided or arranged by the local educational agency in which the school of origin is located.
(II) If the child's or youth's living arrangements in the area served by the local educational agency of origin terminate and the child or youth, though continuing the child's or youth's education in the school of origin, begins living in an area served by another local educational agency, the local educational agency of origin and the local educational agency in which the child or youth is living shall agree upon a method to apportion the responsibility and costs for providing the child or youth with transportation to and from the school of origin. If the local educational agencies are unable to agree upon such method, the responsibility and costs for transportation shall be shared equally.41
Transportation for students experiencing homelessness is another category of school transportation expenses that is contingent on state reimbursement. This service to these students is required by federal law in order for the state to receive various categories of federal money. A DLM determination found this service to be an unfunded mandate in 2011 because the Commonwealth had adopted the provisions of the federal McKinney-Vento Homeless Assistance Act.42 The state is therefore responsible for full reimbursement to the school district(s) that transport students experiencing homelessness.43
Although the Commonwealth has reimbursed this line item at inconsistent levels since FY 2013, reimbursements in FY 2022 reached full funding for the first time at $11.5 million and complied with the mandate.44 The reimbursement level was raised in FY 2023 to nearly $23 million, which will likely cover all McKinney-Vento transportation expenses and account for growing costs.45
Out-of-District School Transportation for Students in Foster Care (Every Student Succeeds Act, Public Law 114–95)
Status: Federal Funding for small percentage of expenses
Estimated expenses (FY 2021): $4,334,60846 FY 2021 Reimbursement: $513,06047
Each local educational agency plan shall provide assurances that the local educational agency will . . .
(5) collaborate with the State or local child welfare agency to . . .
(B) by not later than 1 year after [the date of enactment of the Every Student Succeeds Act], develop and implement clear written procedures governing how transportation to maintain children in foster care in their school of origin when in their best interest will be provided, arranged, and funded for the duration of the time in foster care, which procedures shall—
(i) ensure that children in foster care needing transportation to the school of origin will promptly receive transportation in a cost-effective manner and in accordance with section 675(4)(A) of [the Social Security Act (42 U.S.C. 675(4)(A))]; and
(ii) ensure that, if there are additional costs incurred in providing transportation to maintain children in foster care in their schools of origin, the local educational agency will provide transportation to the school of origin if—
(I) the local child welfare agency agrees to reimburse the local educational agency for the cost of such transportation;
(II) the local educational agency agrees to pay for the cost of such transportation; or
(III) the local educational agency and the local child welfare agency agree to share the cost of such transportation.48
DLM previously investigated state and federal provisions of law covering educational services for children in foster care in a 2019 municipal impact report.49 One of the laws highlighted in the report was the federal Every Student Succeeds Act of 2015 (ESSA), which requires DESE to provide, arrange, and fund transportation for students in foster care in conjunction with the Massachusetts Department of Children and Families (DCF).50 ESSA also requires school districts51 to adequately provide transportation to the schools that students previously attended prior to their placement in care, after determination by DESE and DCF that it is in the best interest of the students.52 As a result, DESE and DCF were required to determine a cost-sharing mechanism to cover districts’ accrued transportation expenses.53 The Commonwealth has never directly funded this provision, although needed funding levels can be easily identified, since DESE collects transportation expense data as well as the number of students in foster care who receive OOD transportation services (915 as of FY 2021).54
Instead of a state reimbursement, the Executive Office of Health and Human Services (EOHHS), DESE, and DCF coordinated efforts to secure a small federal reimbursement for school districts through Title IV-E of the Social Security Act, which was first distributed in FY 2020.55 In FY 2021, transportation expenses for students in foster care totaled $4,334,608, of which $513,060 (or 12%) was reimbursed by the federal government.56 The remaining balance falls on school districts to fund out of their budgets.
Not all school districts take advantage of the Title IV-E funds, as applying for reimbursement is voluntary.57 For the 2019-2020 school year, only 59 out of 115 school districts with students in foster care sought reimbursement.58 Likewise, only 56 out of 89 eligible districts sought reimbursement in the 2020–2021 school year.59 Among the districts that sought federal reimbursement in FY 2021, only 16.8% was reimbursed out of their total expenses of $3.1 million.60 A combination of a lack of awareness of the program and the required time needed to fill out paperwork for the program may hinder districts’ ability or motivation to apply for federal funds, especially when a 100% reimbursement is not guaranteed.
School Aid
Educator Evaluations (M.G.L. c. 71, § 38)
Status: No explicit funding (some funding unofficially allocated in Chapter 70 formula)
Estimated expenses (FY 2021): over $10,000,000 FY 2021 Reimbursement: None
Each school district shall conduct evaluations of teachers and administrators in accordance with the regulations of the board [of elementary and secondary education] and shall be reimbursed for reasonable costs incurred thereby in accordance with section sixty of chapter fifteen.61
M.G.L. c. 71, § 38 sets out a state commitment to reimburse school districts for expenses related to the educator evaluation program. This section identifies teachers, principals, and administrators to be evaluated under standards from the Massachusetts Board of Elementary and Secondary Education. This process was the subject of a 2017 mandate determination by DLM in response to a petition filed by the Framingham School District.62 No funds have ever been explicitly appropriated for the reimbursement of these evaluations, nor has there been evidence of guidelines for reimbursement under M.G.L. c. 15, § 60. However, in the past, DESE recommended use of Federal Title II-A funds to support the evaluation program and pointed to a professional development allocation within the Chapter 70 formula.63 While the costs to school districts of the required evaluation process are not known, an estimate of tens of millions of dollars is reasonable, extrapolating from the numbers Framingham provided as part of the mandate determination.
Education of Students in Foster Care (M.G.L. c. 76, § 7)
Status: Partial funding (via Chapter 70 aid)
Estimated foundation budget expenses (FY 2023): $78,503,552
Estimated Chapter 70 aid (FY 2023): $36,527,70364
For the tuition in the public schools of any city, town, or regional school district of any school age child placed in foster care or group care elsewhere than in his home town by, or there kept under the control of, the department of children and families, the commonwealth shall fully reimburse said city, town, or regional school district for the child’s tuition each day the child is enrolled in a public elementary or secondary school. The amount of said reimbursement shall be based on the average annual per pupil cost of education in the city, town, or regional school district, as determined by the department of education.65
DLM’s 2019 report on children in foster care also highlighted a promised reimbursement for educational services of such children who are assigned to schools outside their home district. M.G.L. c. 76, § 7, which details tuition reimbursement for students placed OOD, has never been funded. However, students in the foster care system are automatically categorized as low income and have additional allocations of up to $6,500 over the foundation base rate per student in the Chapter 70 formula, thus generating more funding for the districts.66 Accurate statistics are not publicly available, since students in this category tend to move between districts more often than others; furthermore, there is no specific funding line item for the education of students in foster care.67 However, EOHHS has estimated that there were at least 5,504 students in foster and state care who were enrolled in public schools as of October 2021.68
Multiplying the number of students in foster care who attended public schools (5,504) by the average FY 2023 Foundation Budget amount of $14,263 per pupil, DLM estimates there are over $78 million per year in expenses to provide educational services for children in foster care.69 Because the Commonwealth funds approximately 46.53% of foundation budget expenses, we estimate that approximately $32 million, or 53.47%, is left to school districts to cover out-of-pocket.70 This estimate is conservative, as there are many students in foster and state care attending districts with high concentration of students from families with low incomes, and as a result, have higher foundation budgets. Students in foster care also tend to have a higher need for IEPs than other students across the Commonwealth and therefore require more resources.71 In addition, there may be higher student counts in upcoming years due to the changing impact of the 2019 coronavirus (COVID-19) pandemic.
Special Education Circuit Breaker (M.G.L. c. 71B, § 5A)
Status: Partial funding (per formula)
Estimated expenses, net of Chapter 70 aid (FY 2022): $749,158,52772
FY 2022 Reimbursement: $348,615,42973
There shall be, subject to appropriation, a special education reimbursement program. The program shall reimburse municipalities for the eligible instructional costs and for the cost of required out-of-district transportation associated with implementing individual education plans of students receiving special education services pursuant to this chapter. The reimbursements shall be in addition to amounts distributed pursuant to chapter 70 and shall not be included in the calculation of base aid, as defined in said chapter 70, for any subsequent fiscal year. Charter schools shall receive reimbursements under this section in the same manner as districts.
The department shall promulgate regulations to define, consistent with this section, the costs associated with implementing individual education plans for pupils that shall be eligible for reimbursement under the program.74
The special education circuit breaker is a cost-sharing program between communities and the state for expenses related to educating the students who have the highest needs for special education services. The formula was modified as a result of the 2019 SOA and now triggers at a threshold amount, beyond which school districts get reimbursed at 75% of allowable expenses.75The amount of reimbursement increased with the SOA, due to a phase-in of OOD transportation costs for students whose expenses exceed the threshold.76 In FY 2022, total expenses exceeded $980 million, with district threshold costs at just under $500 million.77 However, the $980 million is considered to be gross expenses, of which some of it is partly paid for with Chapter 70 aid.78 After subtracting the state’s allocation of Chapter 70 aid for students receiving special education services from total expenses, and after excluding OOD transportation costs, the net expense for the year was approximately $749 million. Approximately $349 million, or 46.53% of net costs, was reimbursed by the special education circuit breaker, leaving approximately $400 million to be absorbed by the local districts.79
Charter School Sending Tuition Reimbursements (M.G.L. c. 71, § 89 (gg))
Status: Partial funding (per formula)
Estimated expenses, net of Chapter 70 aid (FY 2023): $437,677,37380
FY 2023 Reimbursement: $178,889,24881
Any district whose total charter school tuition amount is greater than its total charter school tuition amount for the previous year shall be reimbursed by the commonwealth in accordance with this paragraph and subject to appropriation; provided, however, that no funds for said reimbursements shall be deducted from funds distributed pursuant to chapter 70. The district's reimbursement shall be 100 per cent of the increase in the year in which the increase occurs, 60 per cent of the increase in the year following the increase and 40 per cent of the increase in the second year following the increase.82
Whenever students opt to attend charter schools instead of a public, vocational, or regional school, sending districts are charged tuition for these students. These charges are labeled as assessments on the municipal and regional school Cherry Sheets (see Figure 9 for a detailed breakdown of Chapter 70 aid and charter school assessments).83 Charter school tuition expenses are rising quickly, as charter school assessments (net of reimbursement) increased by 33% between FY 2018 and FY 2023.84 It should be noted that students attending charter schools are included in the student count for the Chapter 70 program, which drives the overall foundation budget, and thus the tuition rates for charter schools.85
There is a reimbursement program (line item 7061-9010) with a formula designed to provide support to the sending districts, but this program only partially offsets expenses. Two components—transitional support for tuition and facilities reimbursement—account for the vast majority of reimbursements: the first component helps districts adjust to recent increases in charter school tuition, while the second component helps support capital costs at charter schools.
In FY 2023, gross charter school tuition expenses totaled over $866 million, some of which is covered with Chapter 70 aid.86 We estimate that approximately $428.3 million in Chapter 70 aid was allocated to students attending charter schools (based on an estimated charter school enrollment of 47,872 and an average Chapter 70 aid amount of $8,497.17 per student attending a charter school from a sending district).87 After subtracting estimated Chapter 70 aid, approximately $179 million out of $438 million (or 41%) in charter school tuition expenses will be reimbursed under the program with transition tuition aid.88 While this commitment was not fully funded in past years, the SOA promised implementation of the appropriate level of support by phasing in funding over a period of years.89
Local Government Programs
Payments in Lieu of Taxes for State-Owned Land (M.G.L. c. 58, §§ 13–17)
Status: Partial funding
Estimated full reimbursement (FY 2023): $48,987,91290
FY 2023 Appropriation: $45,000,00091
The treasurer shall annually, reimburse each city and town in which state-owned land is located, an amount in lieu of taxes upon the reimbursement percentages reported to the treasurer by the commissioner under the preceding section, determined by multiplying the percentages by the amount appropriated for such purposes for the fiscal year.92
The state-owned land payment in lieu of taxes (PILOT) program was the subject of a 2020 report from DLM.93 The report found a significant underfunding of the PILOT program as a result of changes to the program’s formula by the Municipal Modernization Act of 2016 (St. 2016, c. 218 § 108).94 Under the program’s current structure, municipalities are reimbursed based on multiplying the share of their state-owned land relative to the Commonwealth’s total state-owned land value against a legislative appropriation. Note that for the purposes of this report, DLM calculated an estimate of full funding to the program using the methodology from prior to 2016.
Shortly after DLM’s 2020 report, the Legislature started to make larger investments in the state-owned land PILOT program. The program’s appropriation increased from $30 million to $35 million between FY 2020 and FY 2022.95 The Legislature allocated an additional $10 million for the FY 2023 budget, increasing the program’s appropriation to an all-time high of $45 million.96 Full funding levels are currently estimated to be at $49 million.97 Because state-owned land values are revalued biannually, it is important that the Commonwealth consistently increases its financial commitment to the program to keep pace with growing land values.
Community Preservation Act Incentives (M.G.L. c. 44B, § 10)
Status: Partial funding
Net Surcharges Raised (FY 2022): $178,991,952 FY 2022 State Match: $88,477,40498
(a) The commissioner of revenue shall annually on or before November 15 disburse monies from the fund established in section 9 to a city or town that has accepted sections 3 to 7, inclusive, and notified the commissioner of its acceptance. . . .
(b) The commissioner shall multiply the amount remaining in the fund after any disbursements for operating and administrative expenses pursuant to subsection (c) of section 9 by 80 per cent. . . .
(c) The commissioner shall further divide the remaining 20 per cent of the fund in a second round distribution, known as the equity distribution. . . .
(h) When there are monies remaining in the Massachusetts Community Preservation Trust Fund after the first and second round distributions and any necessary administrative expenses have been paid in accordance with section 9, the commissioner may conduct a third round surplus distribution. . . .
(i) The commissioner shall determine each participant's total state grant by adding the amount received in the first round distribution with the amounts received in any later round of distributions, with the exception of a city or town that has already received a grant equal to 100 per cent of the amount the community raised by its surcharge on its real property levy.99
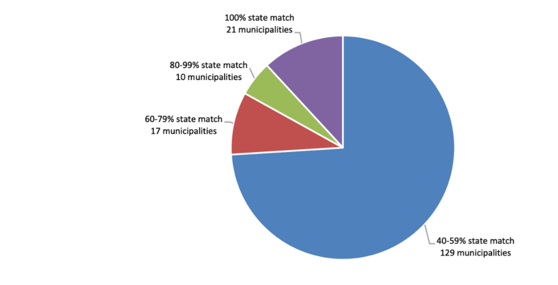
The Community Preservation Act (CPA) is an optional program, through which communities can assess a surcharge to property tax bills that can be directed to a fund for historic preservation, open space management, and affordable housing. As of 2021, 177 communities have opted to participate in this program.100 The state matches local funding at a rate that varies each year, as the distribution of funds is dependent on the amount of collected surcharge revenue and the number of participating communities. There are also some occasional additions to funding: for example, the FY 2023 budget promises a $20 million infusion of surplus funds into the Community Preservation Trust Fund for that year’s CPA incentive reimbursements.101 However, the existing funding regime does not allow many communities to receive the full 100% incentive, as seen in Figure 5.
Figure 5—CPA Communities by Share of State Match, FY 2022102
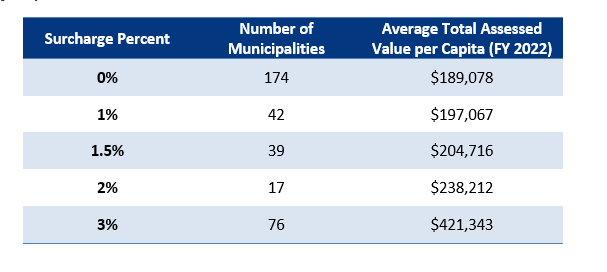
There is an apparent correlation between a municipality’s wealth and the CPA surcharge percent adopted by a municipality. For example, Figure 6 shows the mean assessed values per capita, by CPA surcharge percent, for Massachusetts municipalities. Communities that implemented the 3% surcharge have a significantly higher mean total assessed value per capita than those that implemented the 2% surcharge, which are higher still than those that implemented the 1.5% surcharge, and so on. In particular, the contrast between municipalities participating in the CPA program with the highest surcharges and non-CPA municipalities ($421,343 vs. $189,078 in mean total assessed value per capita in FY 2022) is striking.103
Figure 6—Average Total Municipal Assessed Value by CPA Surcharge Percent per Capita, FY 2022104
The CPA program includes two “equity” rounds of fund redistribution after the first allocation, with the stated goal of increasing fairness. But, even after redistribution, there is a high correlation between a municipality’s total assessed value per capita and CPA funds per capita (see Figure 6): the higher the mean assessed value, the higher CPA reimbursements tend to be. This is an unintended consequence from the CPA statute, which states that only municipalities that implement the equivalent of a 3% surcharge qualify to enter the “equity” rounds.105 It is unclear why the equity rounds are restricted to these communities, given the large amount of historically significant properties also present in many of the lower-income, deindustrialized communities of the Commonwealth (which tend to participate for the CPA program at a lower rate, when they sign up at all).
Municipal Reimbursements for Veterans’ Benefits (M.G.L. c. 115, § 6)
Status: Partial funding
Estimated full reimbursement (FY 2023): $46,808,078106
FY 2023 Estimated Cherry Sheet Reimbursement:$35,106,059107
Subject to . . . decision and allowance [by the commissioner of veterans’ services as to proper and lawful amounts], seventy-five per cent of the amounts of veterans’ benefits paid to applicants by the cities and towns wherein they reside, but none of the expenses attending the payment of such benefits, shall be paid by the commonwealth to the several cities and towns on or before November tenth in the year after such expenditures.108
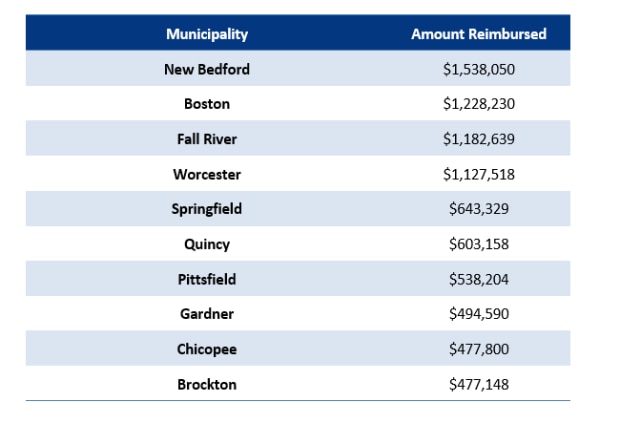
The Massachusetts Department of Veterans’ Services reimburses municipalities for 75% of the benefits paid to veterans by the city or town that the Commissioner of Veterans’ Services deems proper and lawful. These benefits provide emergency and long-term financial assistance to veterans and their dependents for various categories of living expenses and are need-based with thresholds for income and assets.109 It should be noted that the eligible veteran population is not equally spread between municipalities, but instead clustered in a small number of mostly lower-income communities. Judging by reimbursement patterns, most veterans eligible for benefits (>51%) live in approximately 10% of the 351 Massachusetts municipalities, notably in the “gateway cities.”110 In FY 2023, the four communities with the largest veterans’ expenditures were New Bedford, Boston, Fall River, and Worcester, as shown in Figure 7.111 Proceeding with a full financial commitment would have a positive budgetary impact for some of the most challenged municipalities in the Commonwealth.
Figure 7—Largest Recipients of Veterans’ Benefits Reimbursements, FY 2023112
Major Cherry Sheet Programs
As a result of the significant underfunding of the programs discussed above, municipalities and school districts depend heavily on two major “Cherry Sheet” programs for assistance: Chapter 70 education aid and UGGA.
Chapter 70 Local Aid
Overview
The Chapter 70 program, which provides education funding to school districts, is the largest state assistance program in the Commonwealth. The purpose of the program is to define a spending goal for each school district, and then determine how much of that goal should be funded with either state or local resources. Chapter 70 was created with the passage of the Education Reform Act of 1993 and has been amended and refined at various times, most recently with the 2019 SOA.113The program, while complex, is based on the Foundation Budget calculation, which tells local communities what their spending requirement is for public education based on enrollment across grades and then apportions that requirement between a local contribution and state aid.
According to the formula, approximately 41% of the required Foundation Budget expenditure statewide is assumed by the Commonwealth through Chapter 70.114 The balance (approximately 59% on average) is the responsibility of the municipality and/or school district through their local contributions, as shown in Figure 8.115 The actual state share varies by year, according to factors such as hold harmless aid, minimum aid, and foundation aid above target. As a result, the state’s share for FY 2023 was approximately 46.53% of the total foundation budget expenditure, while the local share was approximately 53.47%.116 In fact, districts generally receive between 17.5% and 82.5% of their Foundation Budgets in state aid—with the variation driven by factors such as municipal property values and income (also known as a combined effort yield).117 Although 82.5% is the maximum contribution for a municipality, the Commonwealth is not limited in its own contributions of aid—in a few specific circumstances, communities may get more than 82.5% from the state.
Figure 8—DESE Breakdown of Chapter 70 Target Local Shares118
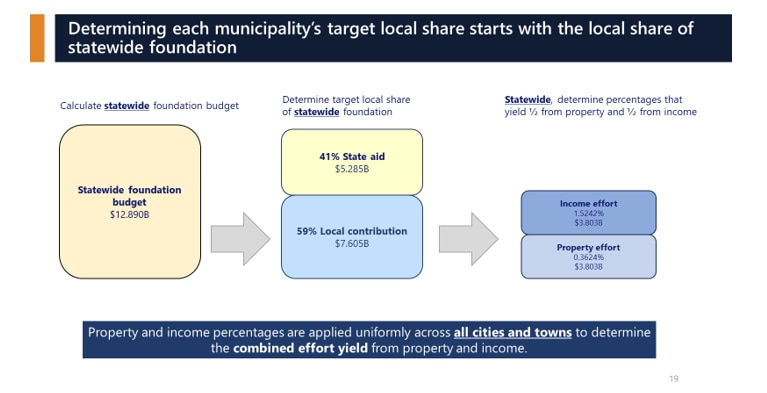
Figure 9—Summary of Chapter 70 Aid and Charter School Assessments, FY 2018 through FY 2023119
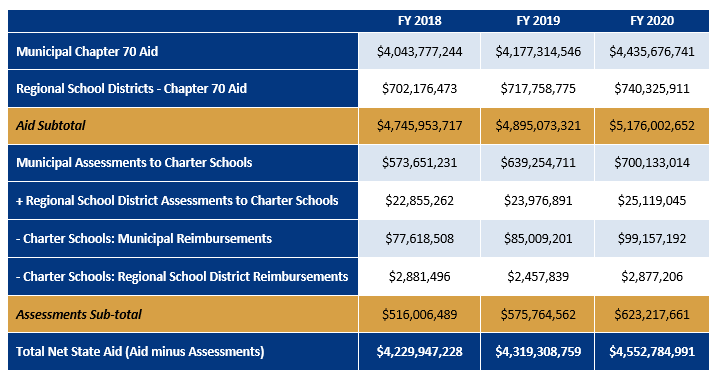
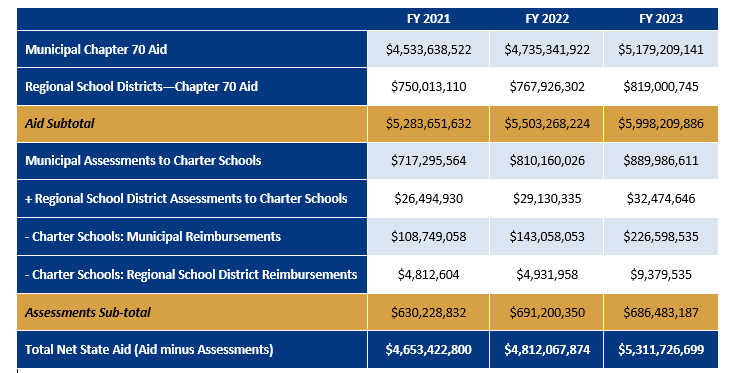
Over the period illustrated in Figure 9 (FY 2018 through FY 2023), there has been an increase in aid of 26.4%, an increase in net aid of 25.6%, and an increase in assessments of 33%.120
The total required school spending varies considerably between school districts, based on individual district characteristics such as income and wealth.121 For example, the City of Brockton is projected to receive over $212 million in aid for FY 2022, against a required local expenditure of $261 million.122 State aid therefore represents 81% of the total required school spending. At the other end of the spectrum is the Town of Lexington, which is projected to receive $14.6 million in aid against a required local expenditure of $81.1 million.123 Lexington’s aid only represents 18% of the total required school spending.
Impacts of the Student Opportunity Act
The 2021–2022 school year was the first year of a six-year transition required by the 2019 Student Opportunity Act, which implements the recommendations of the 2015 Foundation Budget Review Commission. Those recommendations recognized that the previous formula had understated the impact of special education services and health insurance benefits on school budgets. The Commission had also recommended changing the foundation budget formula in order to allocate more money to districts with high concentrations of children from families with low incomes or large percentages of English Learners.124
To adjust for these changes under the SOA, virtually all districts in the Commonwealth will see an increase in their foundation budgets and thus will be required to increase their required net school spending on public education. The formula tries to remedy this issue with a “minimum aid” component that allocates monies to districts that otherwise would not see an increase in Chapter 70 funds. An analysis of data from DESE shows a total of 246 districts receiving a minimum aid of $30 per pupil in FY 2022, and a total of 141 districts receiving $60 per pupil in minimum aid in FY 2023.125 Although many districts will receive additional Chapter 70 aid that will entirely offset the foundation budget increases, some districts will be left to spend more without an increase in aid sufficient to cover the requirement. For example, there are 129 school districts that had increased foundation budgets but only saw an increase in minimum aid between FY 2021 and FY 2023.
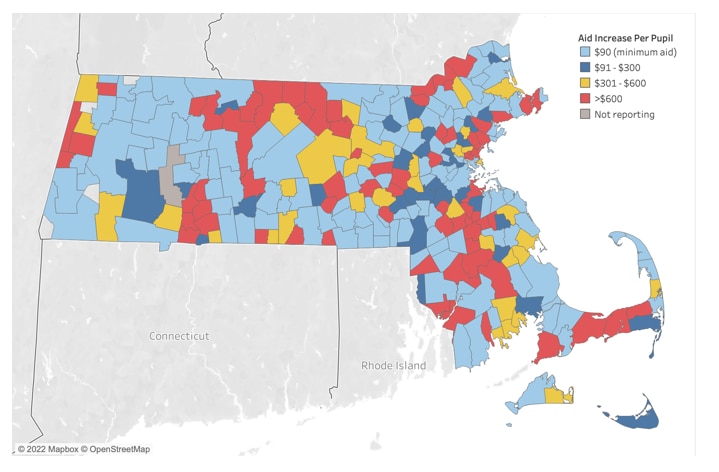
One of the ways that districts are burdened with higher net school spending is decreased enrollment, because most school districts in the state have faced shrinking student populations in recent years. Within the first two years of the implementation of the SOA, at least 251 out of 318 school districts saw declining enrollment, which was exacerbated by students leaving public schools during the COVID-19 pandemic. These districts had an average enrollment loss of -4.93% between FY 2021 and FY 2023 and consist mostly of public and regional school districts. According to Figure 10, at least 126 districts with shrinking student enrollment had only minimum increases of aid of $30 to $60 per pupil between FY 2021 and FY 2023, despite increases of foundation budgets and local contributions that far exceed this amount. The distribution of minimum aid communities touches all parts of the state (as shown in Figure 11, which shows those districts receiving $90 per student across two years). Further analysis may be required of the impacts of minimum aid in future years.126
Figure 10—School Districts in Massachusetts with Declining Enrollment, FY 2021 through FY 2023127
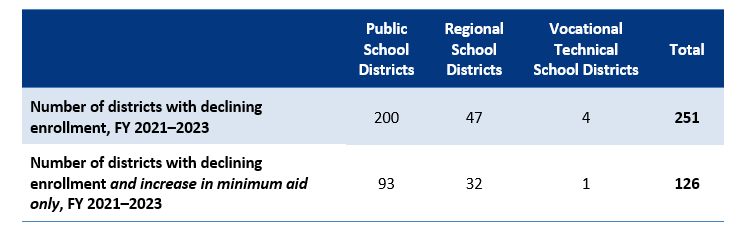
Figure 11—Geographical Distribution of Change in Chapter 70 Aid, FY 2021 through FY 2023128
For FY 2023, there are 200 districts with higher local contributions that were not fully offset with aid increases. However, at least 100 of these districts have significantly higher net school spending (at least 150% above the foundation budget), meaning that the mandated increase had no real effect on local spending for those districts.129
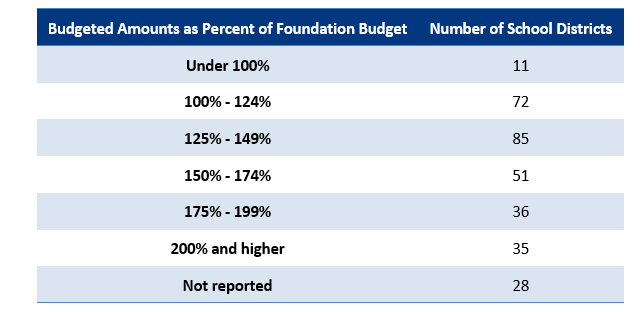
Based on FY 2022 numbers,130 the average net school spending that districts actually budget is 145% of their foundation budgets. Figure 12 shows that 35 districts budgeted at least double their required net spending, while 11 districts did not budget the minimum spending required of them.
Figure 12—Budgeted Net School District Spending as a Percentage of Foundation Budget (FY 2022)131
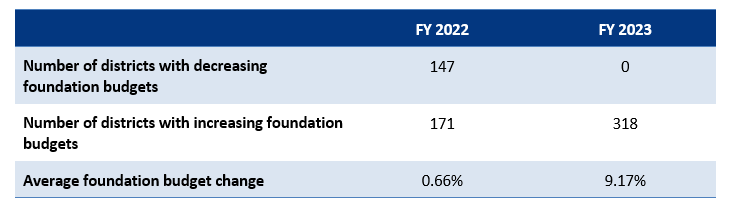
Based on the first two years of SOA implementation, 141 districts were limited to increases in minimum aid, 105 districts have some combination of minimum aid and increased Chapter 70 aid, and 72 districts had two years of increased Chapter 70 aid.132 At the same time, 12 districts saw decreases in their foundation budgets across the two years and 306 saw increases.133 It is important to note that the first two years of the SOA implementation occurred during the COVID-19 pandemic, which brought above-average declines in enrollment in FY 2022 with just a minor loss in FY 2023. This created an unprecedented effect where foundation budgets were reduced in almost half of all school districts in FY 2022, but some districts experienced increases the following year, as seen in Figure 13.
Figure 13—School District Foundation Budgets—Change from Previous Year134
Other Chapter 70 Concerns
Some advocates from the municipalities and school community, such as the Massachusetts Association of Regional Schools (MARS), argue that the SOA requirement for higher spending by districts will lead to stressed local budgets. Pointing to the communities that are asked to spend more as the state total foundation budget increases, MARS faults the 59/41 split of local responsibility versus state support during a period of increased spending requirements as the SOA is implemented. During the 2021–2022 legislative session, Senators Jason Lewis and Joan Lovely advocated to repair this issue with a bill (S.355), which would have gradually increased the state’s contribution from 41% to 46%.135
There have been calls for policy changes from advocacy groups, such as the Massachusetts Business Alliance for Education (MBAE), to make the Chapter 70 formula more sensitive to variations in income and wealth.136 The MBAE questions whether the elements of Chapter 70 that provide base-level support for many districts would be better spent on increased funding for the lowest-resourced communities. The group recommended a phased approach to reforming the formula, such as eliminating minimum aid and hold-harmless aid,137 as well as increasing required spending by higher-income communities.
The recently-released report from the Commission on the Fiscal Health of Rural School Districts expressed concerns about Chapter 70, noting that the aid amounts allocated to rural school districts do not reflect the realities of declining enrollments, above-average costs per pupil, and large transportation expenses attributed to longer distances.138 To rectify these concerns, the Commission has proposed increasing the Rural School Aid appropriation, as well as creating a rural school transportation aid program.139 Rural School Aid increased from $4 million to $5.5 million for FY 2023.140 Previous work by the Special Commission on Improving Efficiencies Relative to Student Transportation had similar recommendations regarding technical assistance for school districts struggling with transportation costs, loosening of restrictive laws that limit transportation choices and an examination of the unfunded transportation programs.141
Furthermore, the United States has entered a period of high inflation, comparable in magnitude to the period of the 1970s and early 1980s.142 While actual growth rates for state and local governments’ major revenue sources varied widely across different revenue components during that period, municipalities experienced a real revenue decline, unlike state governments. Given the interest rates during that period, municipalities were also unable to borrow for investment in capital facilities and equipment and suffered adverse effects over time.143 This history highlights the importance of the state assuming more educational funding commitments in an environment in which municipal revenues are likely to shrink as measured against inflation.
Unrestricted General Government Aid (IGGA)
The second-largest source of aid to municipalities is Unrestricted General Government Aid, which allows cities and towns to use state funds for a wide variety of municipal services, such as public safety and infrastructure. The UGGA program as it stands today was established in FY 2010, after the consolidation of two previous general aid programs, which also cut the amount of aid that was distributed to communities.144 This program utilizes a formula that involves an increase in total aid spread as an equal percentage across all cities and towns. In FY 2023, UGGA totaled over $1.2 billion in funds to municipalities—its highest level since FY 2009.145
Figure 14—Correlation between Population and UGGA, FY 2022146
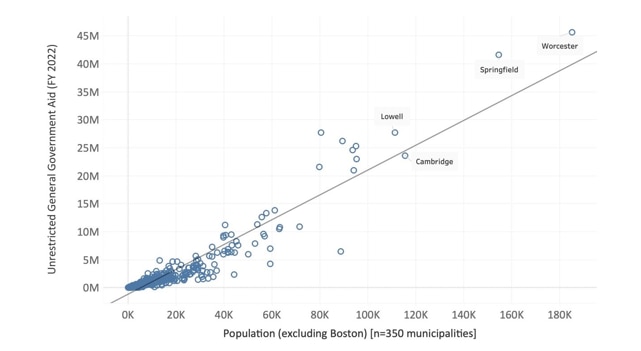
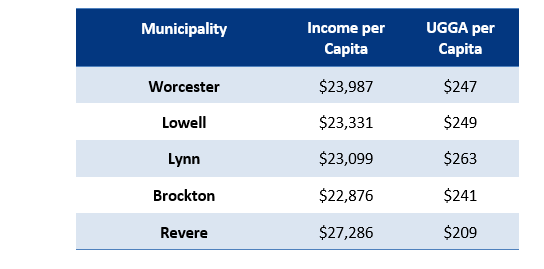
Even without adjustments to the UGGA formula, there is a strong correlation between communities’ population size and aid, as seen in Figure 14. Despite this correlation, there are significant differences between like-sized communities in aid per capita, as seen in Figure 15. For example, note how Lynn’s income per capita is around 1% higher than Brockton’s, and yet Lynn’s UGGA receipts per capita are around 9% higher.147
Figure 15—Comparison of UGGA per Capita for 5 Massachusetts Municipalities at Similar Income Levels, FY 2022148
The Massachusetts Municipal Association (MMA) has raised concerns regarding the basis used to increase UGGA in recent years. Each year, the Governor’s budget recommendation increases UGGA by the consensus estimate of the budget revenue increase.149 However, by the end of the fiscal year, state receipts have recently been far higher than initially predicted.150 For the past two fiscal years this situation has meant a budget revenue increase of 3.5% as compared to actual revenue jumps of 22%.151 For example, the MMA asked for an increase of $85.3 million to UGGA for the FY 2023 budget, instead of the $31.5 million increase recommended by the Governor.152 When the Legislature released its final FY 2023 budget to the Governor, the increase came in at $63.1 million.153
Other Local Aid Programs
The intent of this report is to highlight unmet financial commitments to various local aid programs by the Commonwealth, but there are other categories of state aid that have dedicated or discretionary funding and, as a result, do not fit the report’s framework. Therefore, DLM’s analysis of local aid is not a comprehensive discussion of all state programs, grants, reimbursements, and appropriations. Some Cherry Sheet programs that are not covered in this report include public library assistance, tax exemption programs for veterans and the elderly, and local shares of racing taxes. In addition, discretionary grants not discussed in our analysis include the MassWorks Infrastructure Program, the Municipal Small Bridge Program, and the Municipal Vulnerability Preparedness Program, among others. Other reimbursement programs not mentioned in this report include Uniform Polling Hours and Early Voting funding for elections, as they are fully funded by the Legislature after parts of these programs were determined by DLM to be unfunded mandates.