Mass Save Overview
Mass Save is a collaborative of the Commonwealth’s investor-owned electric and natural gas utilities, formed to “empower residents, businesses, and communities to make energy efficient upgrades by offering a wide range of services, rebates, incentives, trainings, and information.”7 Importantly, Mass Save is not a state agency or an independent state agency.8
The collaborating utilities serve as Mass Save program administrators (PAs), collectively proposing three-year energy efficiency plans pursuant to directives in the Green Communities Act enacted by the Commonwealth in 2008.9 The overarching purpose of Mass Save as reflected in the proposed plans is to achieve reductions in energy use, in part by incentivizing property owners to invest in energy-efficiency upgrades.10
Mass Save incentives are funded primarily by customers of the collaborating utilities, through mandatory energy efficiency charges (EECs) via their electric and gas bills calculated based on use.11 EECs are set at a specific level in the proposed plans in cents-per-kilowatt-hour (or ¢/kWh) for electricity and dollars-per-therm (or $/therm) for natural gas. As of 2024, EECs added around $200 per year to the electricity bill of the average residential customer and around $150 per year to the gas bill.12
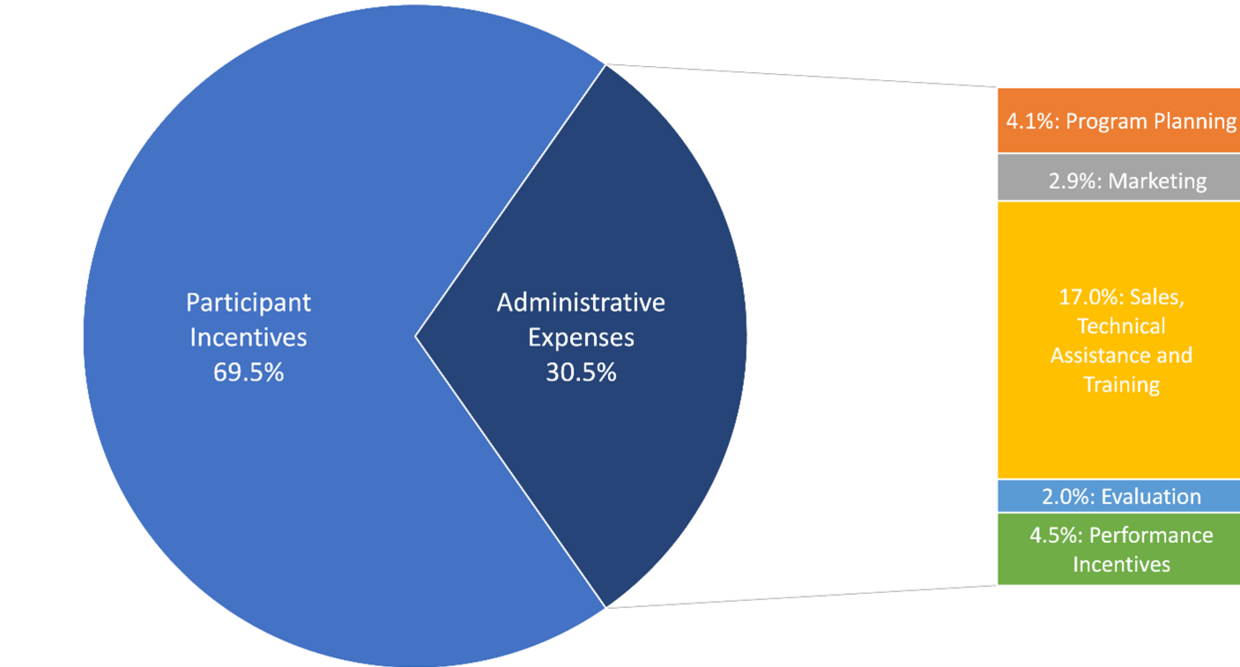
For the period of data availability (2019–2023; see Data Overview for more information), 69.5% (or $3.7 billion) of the Mass Save budget was allocated to be disbursed to program participants as incentives, with the remainder allocated to program planning and administration (4%, or $216 million); marketing and advertising (2.9%, or $155 million); sales, technical assistance, and training (17%, or $908 million); evaluation and market research (2% or $109 million); or PA performance incentives (4.5%, or $239 million).13 See Figure 1 for more information; also, see Appendix A for Mass Save’s historical budgets.
Governance and Regulatory Oversight
The Green Communities Act also established the Energy Efficiency Advisory Council (EEAC).14 EEAC is composed of 15 voting members who represent state agencies, the Attorney General’s Office, consumer advocacy groups, and environmental organizations.15 EEAC is chaired by the Commissioner of the Department of Energy Resources. This department provides policy direction and technical support for EEAC.16 EEAC reviews proposed energy efficiency plans and refines program designs, with its stated priorities being “to develop, implement, evaluate, and monitor the implementation of these plans.”17 EEAC is also charged with “developing a long-term vision for the Commonwealth’s energy future” and works “to achieve energy efficiency savings and to maximize the economic and environmental benefits of energy efficiency.”18
Once EEAC vets the proposed energy efficiency plans, the PAs submit the plans to the Department of Public Utilities (DPU), together with EEAC’s approval or comments and a statement of any unresolved issues.19 DPU conducts a formal review process, which includes public hearings and comment periods.20 Once the proposed energy efficiency plans are approved, PAs manage implementation while service providers authorized by Mass Save carry out the actual efficiency upgrades and installations.21
Program Offerings and Equity Considerations
Mass Save’s programs and initiatives encompass a wide range of energy-efficient upgrades and educational efforts.22For example, Mass Save incentivizes insulation upgrades, encouraging property owners to add insulation to attics, walls, and basements, as well as sealing air leaks around windows, doors, and other openings.23 Mass Save also promotes the installation of energy-efficient appliances, particularly Energy Star–certified refrigerators, washing machines, and dishwashers, while offering rebates for high-efficiency heating and cooling systems, including heat pumps.24 Lighting improvements were an aspect of Mass Save’s early efforts; the program encouraged consumers to switch from incandescent bulbs to more efficient compact fluorescent (also known as CFL) and later light-emitting diode (also known as LED) options, providing discounts on energy-efficient light fixtures to facilitate this transition.25
Over the years, the program has evolved to include other policy priorities, including energy equity.26 Because state energy costs have been persistently higher than the national average, ensuring access to affordable energy for all is especially important in Massachusetts.27 In particular, the American Council for an Energy Efficient Economy notes that 12.4% of the Greater Boston metropolitan area households (of which, there are 230,652) experience a severe energy burden (defined as energy bills greater than 10% of household income), while a further 12% of the Greater Boston metropolitan area households (of which, there are 216,706) have a high energy burden (defined as energy bills greater than 6% of the household’s income).28 Statewide, the typical household electricity bill is $3,552 per year, which is 52% higher than the national average electric bill of $2,340 per year.29 For natural gas, Massachusetts residents pay an average of $17.20 per thousand cubic feet, which is 29% more than the US average of $13.36 per thousand cubic feet.30
Poorly designed energy incentive programs can unintentionally worsen policy outcomes. For example, a 2016 study found that US households received over $18 billion in tax credits for various energy investments (such as home weatherization and solar panels), with the top 20% of earners receiving approximately 60% of the tax expenditure ($10.8 billion), and the bottom 60% of earners receiving only around 10% ($1.8 billion).31 More recently, a 2024 study of US residential energy tax credits found that tax credits primarily benefited higher-income taxpayers: When analyzing the distribution of the Residential Energy Efficient Property credit and the Nonbusiness Energy Property credit, it was observed that these tax credits exhibit regressivity (meaning that a disproportionate share of the benefits goes to higher-income groups). The study concluded that over 57% of tax expenditures went to the top 20% of income earners; conversely, only 0.02% of these expenditures benefited the lowest 20% of income earners.32 It is therefore crucial to examine the distribution of statewide energy incentives via Mass Save to verify that the Commonwealth’s practices do, in fact, maximize equitable access for residents.33
Data Overview
DLM received data from Mass Save, including the following:
- the program’s total number of ratepayers;
- the EEC paid into Mass Save from all ratepayers;34 and
- total program incentives disbursed from Mass Save to program applicants.
Mass Save categorized the data by zip code, PA type (electric or gas), and sector (residential and commercial/industrial).
There are several limitations to the data. First, Mass Save incentive data is not publicly available, and there are significant delays in its release. For example, we initially requested data in April 2023 for program years 2019–2021, but did not receive that data until November 2023; similarly, data for 2022 and 2023 was not available until March 31, 2025.
Second, the data was aggregated according to DPU standards for Mass Save under EEAC Order 14-141 to protect customer privacy, which means that data was excluded for zip codes with fewer than 100 residential customers and/or fewer than 15 commercial customers.35 This exclusion affected a third of the state’s zip codes but only approximately 2.4% of the state population.
Further, approximately 9% of Mass Save incentives could not be assigned to zip codes and are therefore excluded from zip code–level reporting.36 This includes, for example, 6% from residential improvements like light bulbs and pool pumps (for 2019–2021 only); 5% from HEAT loan interest buy-downs; and 2% from active demand reduction programs, which were not integrated into the system at the time of data delivery.37 An additional 1% was added by Mass Save in the data provided to us as a reconciliation line item to ensure that totals matched what was reported to DPU.38 This report focused, therefore, on the available 91% of mapped incentives for the 2019–2023 period.39 At the municipal level, data was available for 322 out of 351 Massachusetts municipalities, including 24 out of 26 GCs.40
Figure 1 below summarizes areas of Mass Save planned expenditures for the period 2019–2023. (Note that throughout this report, all tables, figures, and statements refer to this period, unless indicated otherwise.) Mass Save budgeted paying out $3.7 billion in incentive pay-outs to program participants, on a total expense budget of $5.33 billion. On the revenue side, PAs had estimated an income of $5.39 billion, with the large majority of this sum coming from the energy efficiency charge (EEC)—which was 90%—and the rest from secondary sources (see Footnote 11 for more information). There is a difference because of estimated carry-over (which are the unspent funds from previous program years that are carried into the current period and used to support ongoing or future expenses).
Figure 1. Mass Save PA Planned Expenditures, Total Amounts (2019–2023)*
| Expense Category | Expense Subcategory | Electricity | Gas | Total | Percentage of Total Planned Expenditures |
|---|---|---|---|---|---|
| Participant Incentives | $2,594,340,357 | $1,110,671,996 | $3,705,012,353 | 69.5% | |
| Administrative Expenses | of which: | $1,125,271,327 | $503,090,598 | $1,628,361,925 | 30.5% |
| Sales, Technical Assistance, and Training | $599,148,172 | $309,302,130 | $908,450,302 | 17.0% | |
| Performance Incentive | $191,358,345 | $47,375,739 | $238,734,084 | 4.5% | |
| Program Planning | $154,326,006 | $62,347,037 | $216,673,043 | 4.1% | |
| Marketing and Advertising | $101,740,758 | $53,761,953 | $155,502,711 | 2.9% | |
| Evaluation and Market Research | $78,698,046 | $30,303,739 | $109,001,785 | 2.0% | |
| Total Planned Expenditures | $3,719,611,683 | $1,613,762,593 | $5,333,374,276 | 100% |
* See Massachusetts Energy Efficiency Advisory Council. Massachusetts Statewide Energy Efficiency Plan 2022–2024. Submitted April 30, 2021. https://ma-eeac.org/wp-content/uploads/Mass.-Statewide-Energy-Efficiency-Plan-Submitted-April-30-2021.pdf, Appendix C, p. 9 and p. 14. Planned figures only.
Figure 2. Distribution of Mass Save PA Planned Expenditures by Category,
Total Amounts (2019–2023)
Finally, while we did not have access to other primary data, Mass Save has conducted studies in the past on program participation rates. Most notable among these are the Residential Nonparticipant Market Characterization and Barriers Study, which attempted a largely sociological characterization of nonparticipants, and the Residential Nonparticipant Customer Profile Study, which assessed relationships between participation rates and select customer characteristics.41 The latter found that participation rates are lower for low- and moderate-income households, for renter households, and for households living in houses constructed before 1950, and recommended changing the program design in order to better integrate these populations.
As noted above, significant delays in releasing Mass Save data undermine transparency, timely analysis, and accountability.42 For instance, the previously cited in-house studies were published using three-year-old data. This is particularly concerning given the $109 million investment over the 2019–2023 period in program evaluation and market research—activities that fundamentally depend on access to current and accurate information.
| Date published: | September 29, 2025 |
|---|