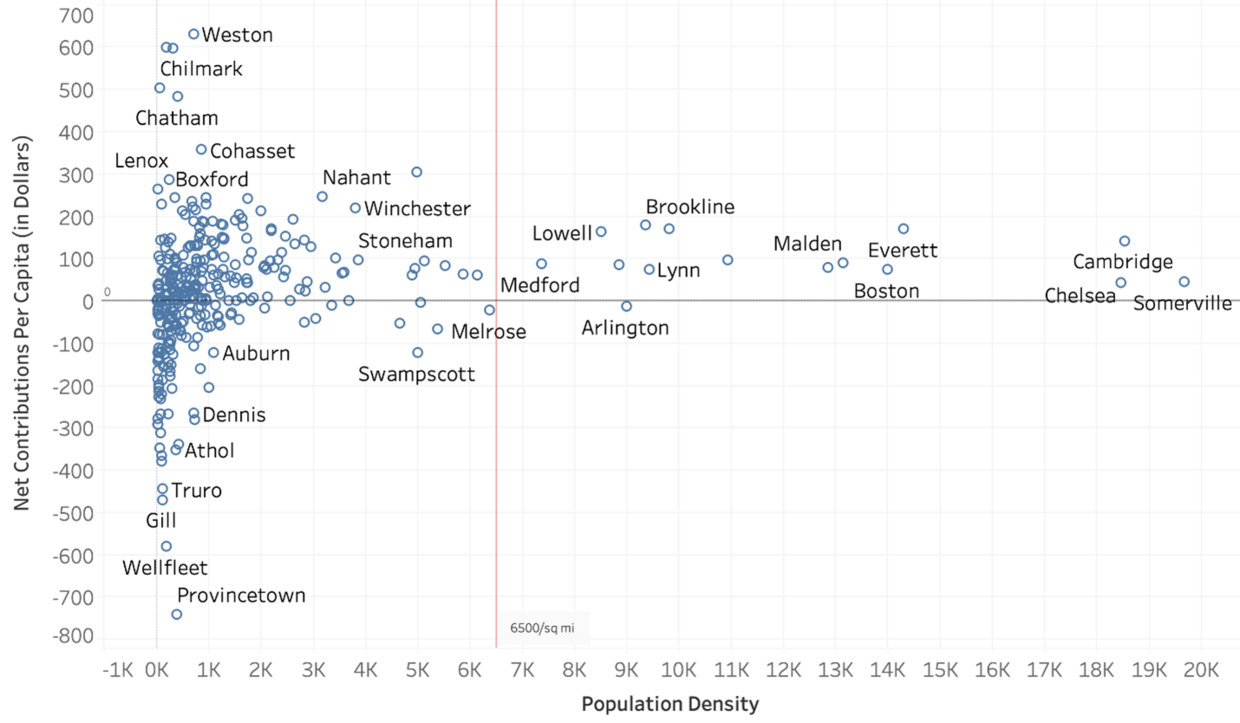
Municipalities with higher population densities tend to contribute more per capita in EECs to Mass Save. Figure 8 shows that all cities and towns with a population density over 6,500 residents per square mile (except for Arlington) contribute more money than they receive.55 In other words, the residents of net contributor municipalities tend to live in the larger, denser cities. In Figure 8, nearly all municipalities to the right of the 6,500 residents per square mile reference line (those with greater housing density) are net contributors.
Figure 8. Mass Save Net Contribution by Population Density (2019–2023)
We also want to highlight the correlation of Mass Save incentives with tenancy status. In 2021, approximately 37% of Massachusetts residents were renters while 63% were homeowners.56 Renters lack legal control over property modifications and consequently have limited ability to reduce energy costs in properties they do not own.57 Of the 126 net beneficiary municipalities, only 10 were above the state average for renter-occupied housing. In this analysis, net beneficiary municipalities are those that receive more in Mass Save benefits than their residents collectively contribute through energy bills, while net contributor municipalities contribute more than they receive in return. Notably, the majority of municipalities with fewer renters are net beneficiaries, whereas net contributor communities tend to have more renters. Figure 9 isolates all net beneficiary municipalities and suggests that municipalities with higher rates of home ownership are more likely to receive Mass Save money.58
Figure 9. Mass Save Money Received by Renter Percentage
(Net Beneficiary Communities Only) (2019–2023)
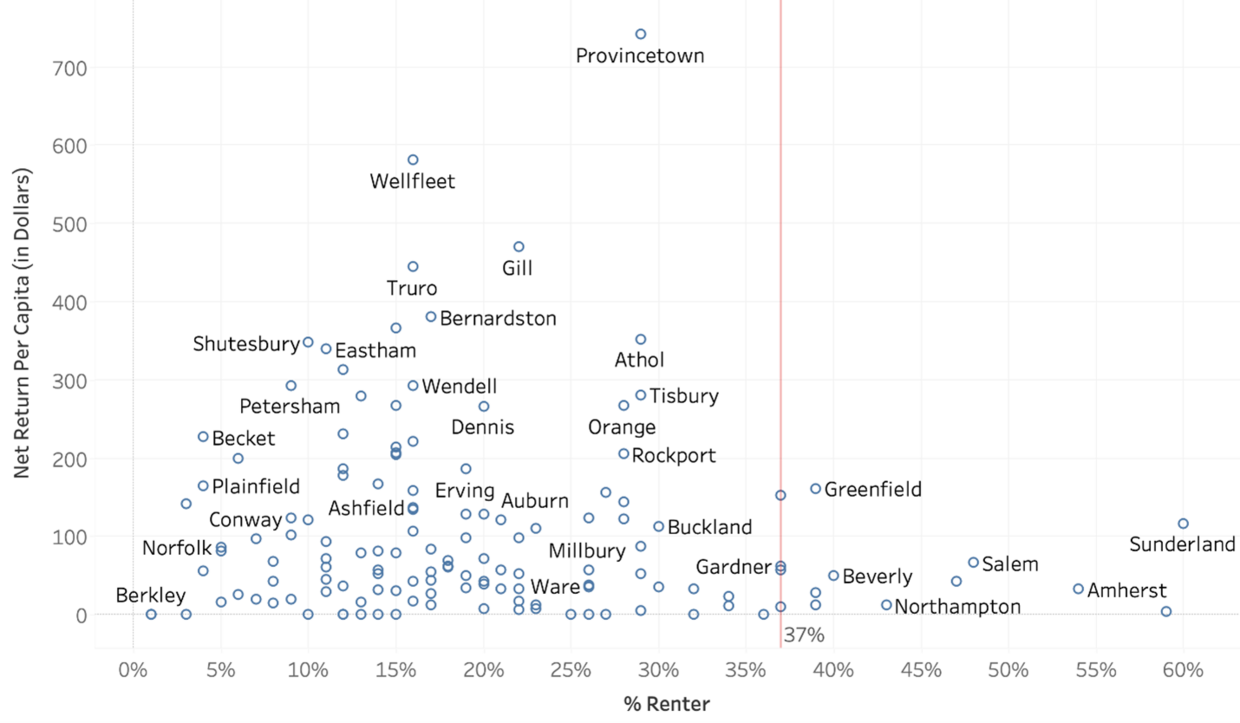
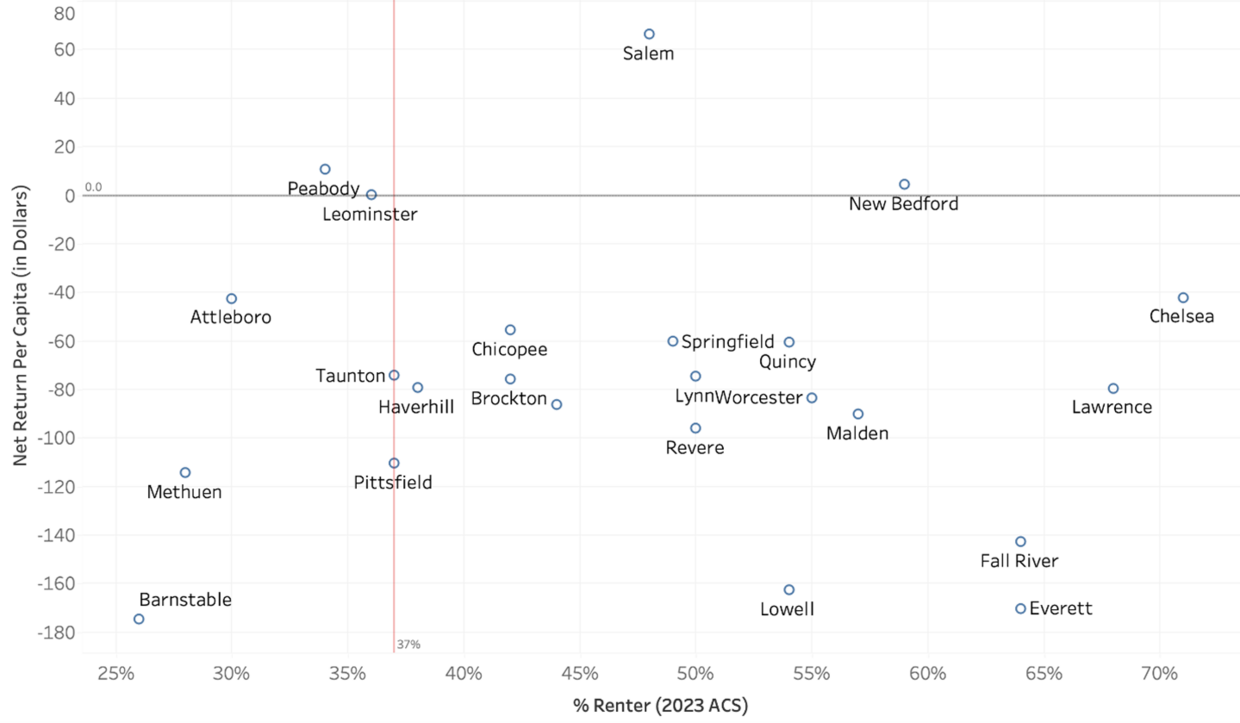
Figure 10 divides GCs into four categories: net contributors versus net beneficiaries (on the y-axis), and renter percentages above and below the state average (on the x-axis). The majority of GCs are in Figure 10’s lower-right quadrant, representing net contributor cities with more renters than average. Only 3 GCs are net beneficiaries (Salem, New Bedford, and Peabody), and only 5 are below the state average in terms of renter percentage (Leominster, Peabody, Attleboro, Methuen, Barnstable). Of the 24 GCs for which data is available (see Data Overview for more information), 19 have a renter percentage greater than the state average of 37%, with 11 of the 19 having 50% or more residents renting. These higher renter percentages likely play a role in the disparity in net contributions to Mass Save between GCs and non-GCs.
Figure 10. Mass Save Net Return per Capita by Renter Percentage (GCs Only)
(2019–2023)
| Date published: | September 29, 2025 |
|---|